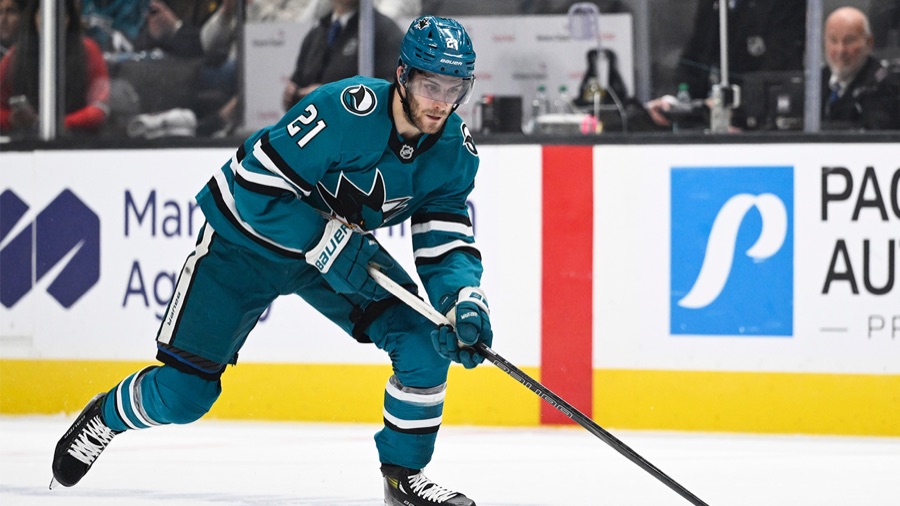
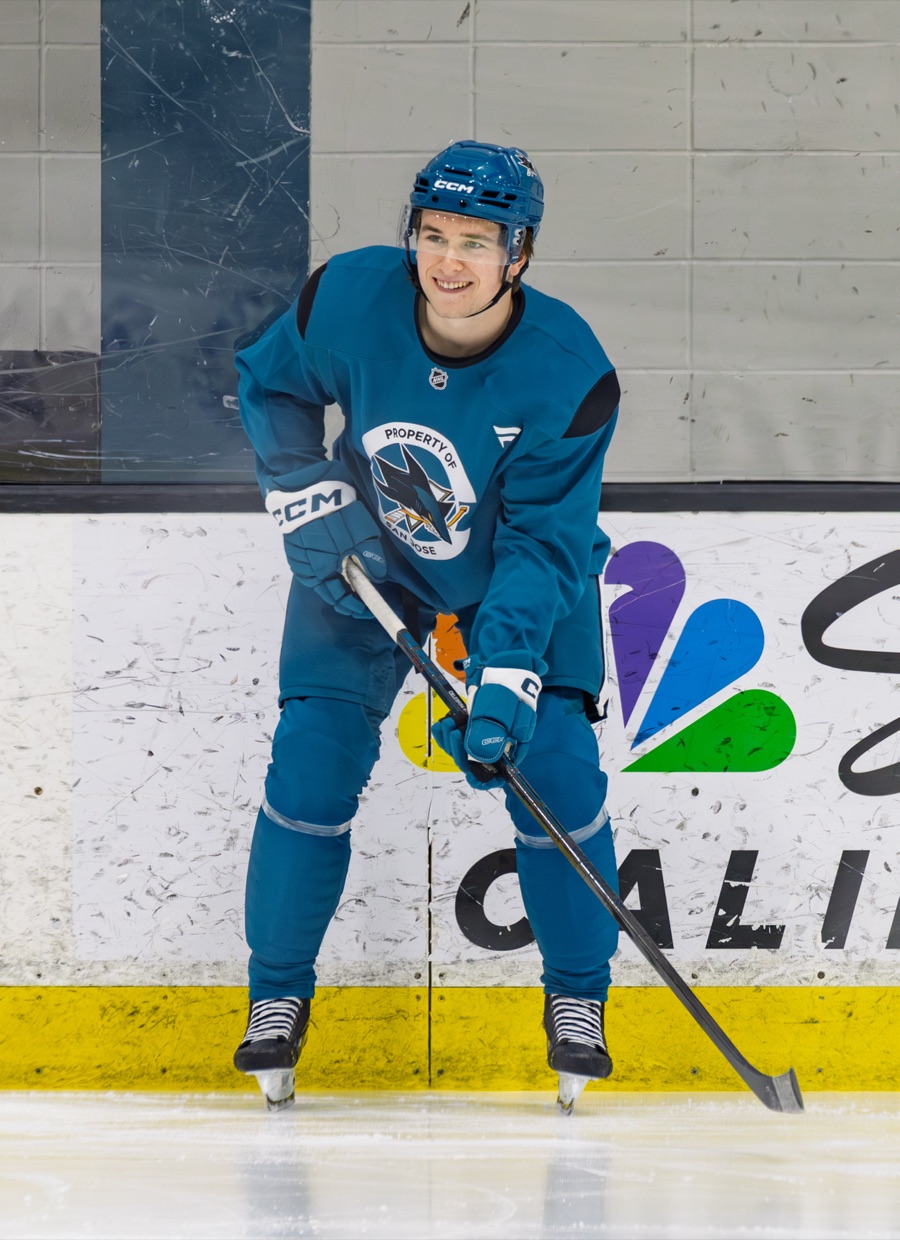
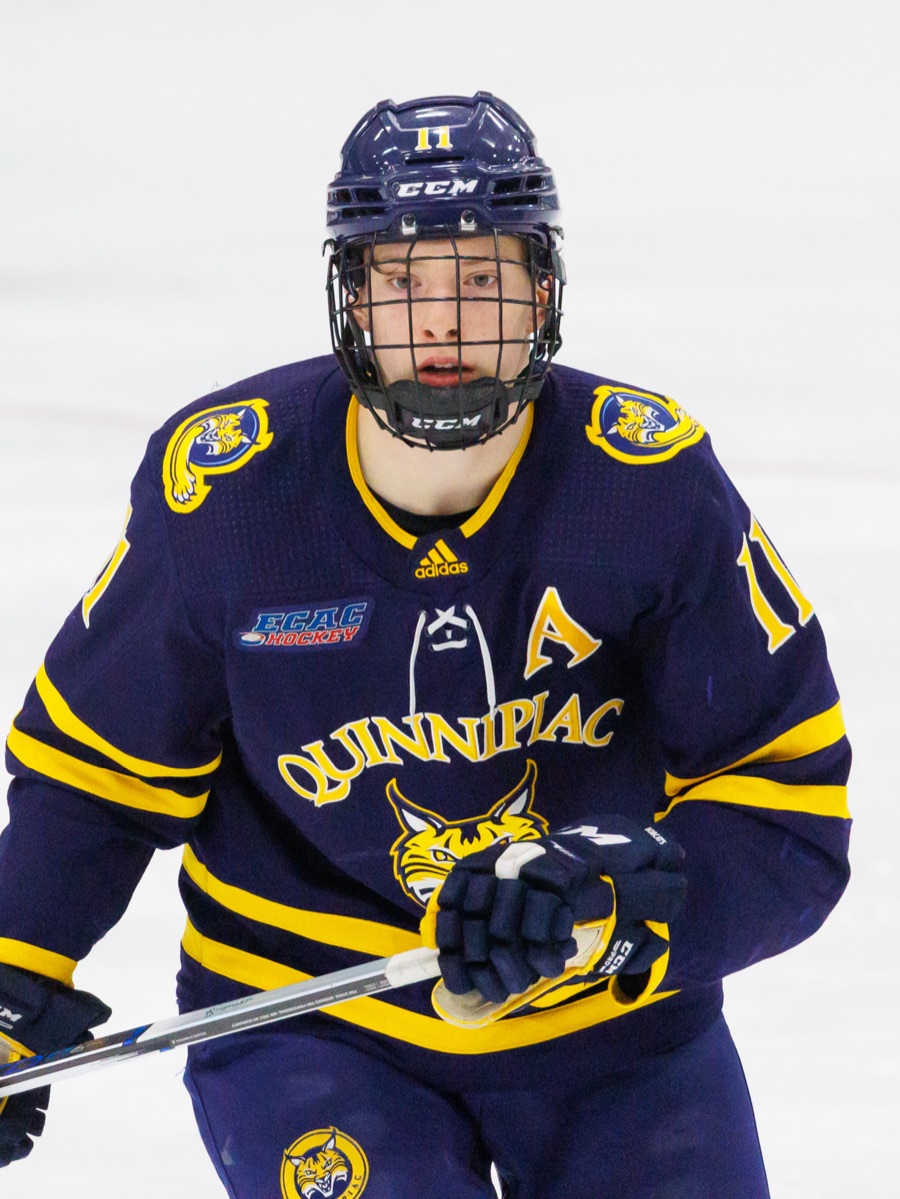
Cagnoni went from four-fifths of the power play to half of it
Dmitry Orlov and Jacob Trouba have taken the power-play minutes he lost. The tracking data shows the same skater who played three NHL games last April.
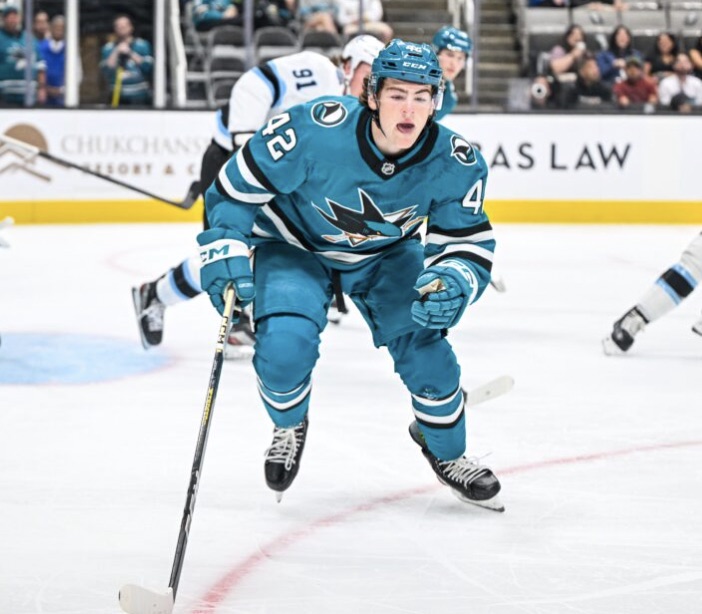
Luca Cagnoni played 81.5 percent of San Jose's five-on-four minutes in the season's first three games and 51.0 percent in the four since, by MoneyPuck's game-by-game files. His all-situations ice time fell over the same stretches, from 20:33 a game to 17:11.
Last season was three NHL games in April, which is not a baseline. His real 2025-26 season was with the San Jose Barracuda, the club's AHL affiliate, and the AHL has no tracking data to bring into this comparison. The NHL player record puts that season at 43 points across 67 AHL games.
| Measure | 2026-27, 7 games | 2025-26, 3 games | Kind |
|---|---|---|---|
| Distance per 60, all situations | 8.93 miles | 9.03 miles | Rate |
| Distance per 60, even strength | 8.85 miles | 8.91 miles | Rate |
| Bursts over 20 mph per game, all situations | 0.00 (0 in 7) | 0.33 (1 in 3) | Rate |
| Average shot speed, all situations | 66.48 mph | 63.42 mph | Average |
| Top skating speed in regulation, through his first three games each season | 19.90 mph | 20.10 mph | Three-game maximum |
| Hardest shot, through his first three games each season | 76.21 mph (83.36 through seven) | 80.38 mph | Three-game maximum |
| Five-on-four share of team time | 81.5% first three games; 51.0% last four | Not available | Share by stretch |
| Ice time per game, all situations | 18:37 | 18:02 | Rate |
| Five-on-five expected-goal share on ice | 35.3% in 105.1 minutes | 48.7% in 44.8 minutes | Share |
| Five-on-five expected-goal share off ice | 40.6% | 55.2% | Share |
The power play#
The season average conceals the change in Cagnoni's work. His all-situations 18:37 per game ranks fifth among seven San Jose defensemen. Sam Dickinson, Cagnoni and Dmitry Orlov sit within five seconds of each other per game, which makes the ordering a stopwatch argument.
The power-play split is less delicate. Cagnoni played 11.08 of San Jose's 13.60 five-on-four minutes in the opening three games, then 9.83 of 19.28 in the following four. The Sharks had more time available in the later stretch, and he received less of it. On Oct. 13 and Oct. 15, he played 5.67 minutes and Orlov played 5.42 out of the team's 11.20.
That near-even split with Orlov covers only the last two games. The first half of the drop came on Oct. 8, when Orlov played 0.27 five-on-four minutes and Jacob Trouba played 3.83, beside Cagnoni's 3.97. The minutes do not say why the assignments changed. With Cagnoni on the ice, San Jose's five-on-four expected-goal production fell from 8.58 per 60 in the first three games to 3.07 in the last four, on small samples of 11.08 and 9.83 minutes, respectively. His own five-on-four shot attempts numbered four in each stretch, leaving him with eight attempts in 20.92 five-on-four minutes across the season's seven games.
Five-on-five#
MoneyPuck's game-by-game files give San Jose 35.3 percent of the five-on-five expected goals with Cagnoni on the ice over 105.1 minutes, against 40.6 percent with him off across seven games. Inside those totals, the share with him on the ice has risen. The opening three games produced a 25.5 percent share in 49.8 minutes; the last four produced 43.1 percent in 55.3 minutes.
San Jose improved around him as well, with its off-ice share rising from 31.4 percent to 46.9 percent over the same stretches. The timing overlaps his reduced power-play role without establishing that the reduction helped his five-on-five play. Most of his minutes come beside one partner. MoneyPuck's line-combination file has Orlov beside him for 84.7 of his 105.1 five-on-five minutes, with a 34.5 percent expected-goal share and goals of one for and five against in those shared minutes.
The legs#
Nothing in the NHL Edge comparison establishes a changed skater. The outline is similar in April and October, with almost no bursts over 20 mph, above-average distance covered and a below-average shot. He has no such burst in seven games this season and had one in three last season. Through his first three games each season, his top regulation skating speed was 19.90 mph this season and 20.10 last season.
Distance gives that speed reading some useful company. In all situations, Cagnoni covered 8.93 miles per 60 through seven games this season against a league average of 8.55, and 9.03 through three games last season against 8.48. He covers ground without producing much top-end speed in these samples. His all-situations average shot speed remains below the league average too, at 66.48 mph against 68.98 through seven games this season, compared with 63.42 against 67.85 through three games last season.
The arguments against me#
- The samples can move the evaluation considerably. San Jose's five-on-four production with Cagnoni has fallen, but a productive shift would carry considerable weight in a stretch containing only 9.83 minutes across four games.
- The team improved with Cagnoni off the ice too. Reading his rise as an individual breakthrough gives him credit for a broader change, with San Jose's off-ice five-on-five share reaching 46.9 percent over the last four games.
- The opening allocation may prove the unusual stretch. A sustained shared assignment would make the early workload a poor expectation for Cagnoni, who received 81.5 percent of San Jose's five-on-four time across the first three games.
The card#
The site's 2025-26 card withholds every percentile because Cagnoni was under 200 five-on-five minutes. There is no last-season portrait to compare against. This season's Pine Net Rating, built on MoneyPuck, is minus-1.29 through seven games, ranking him 13th among 20 San Jose skaters and fourth among seven defensemen.
My open call remains that Cagnoni will average under 0:30 per game shorthanded across San Jose's first 20 games of 2026-27. The shrinking power-play share concerns a different part of his assignment, where he has already gone from a heavy opening workload to an almost even split with Orlov. His penalty-killing work so far amounts to 22 seconds across seven games.
Sources: NHL Edge (2025-26 and 2026-27); the NHL's game logs, stats feed and game summaries; MoneyPuck's season, line-combination and game-by-game files (2025-26 and 2026-27); the NHL player record for his AHL line.