Nurse plays half of San Jose's penalty kill, his weakest job last season
Darnell Nurse's shorthanded time has gone from 1:29 a game in Edmonton to 2:44 in San Jose. His skating holds up through six games; his shot is slower, and the Sharks allow 15.23 four-on-five chances against per 60 with him on.
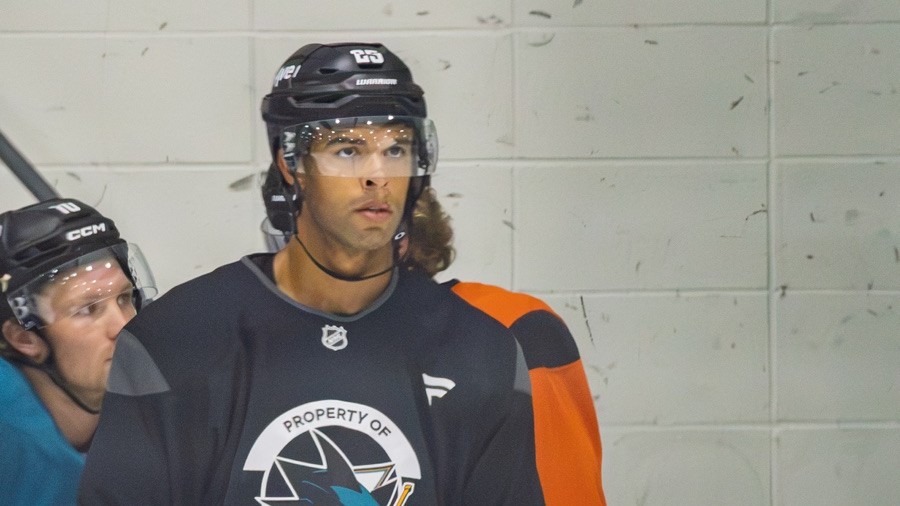
Darnell Nurse has played 51.3 percent of San Jose's four-on-five minutes in the games he dressed, up from 34.4 percent of Edmonton's last season. The Sharks have expanded the job that received his lowest grade on the 2025-26 hockey card, the 4th percentile among 189 league defensemen for penalty-kill chances against.
Last season means a full 82 games in Edmonton; this season means six games in San Jose. Rates carry that comparison, and every percentile from this season is noisy. The workload is firmer ground than the results. Across all shorthanded situations, his ice time per game has risen from 1:29 over those 82 games to 2:44 over these six.
The kill#
MoneyPuck's four-on-five expected goals against, called chances against here, measure the chances allowed by their expected scoring value. Nurse's rate last season was 9.55 per 60 minutes over 118.1 minutes. That placed him at the 4th percentile on the card, meaning 96 percent of the defensemen in that pool allowed fewer chances per 60.
San Jose's early split makes the larger assignment uncomfortable. In Nurse's six games, the Sharks allowed 15.23 chances against per 60 with him on and 7.53 with him off. Those are tiny samples, 16.4 minutes and 15.6 minutes respectively. They describe what happened during his shifts, without establishing how much belongs to him.
The minutes establish the allocation more securely. MoneyPuck's season table puts Nurse second in total four-on-five time among Sharks defensemen, behind Trouba's 22.0 minutes in seven games. His power-play assignment barely requires a stopwatch, totaling two seconds across six games.
| Measure | 2026-27, 6 games | 2025-26, 82 games (Edmonton) | Kind |
|---|---|---|---|
| Share of team four-on-five time in his games | 51.3% | 34.4% | Share |
| Shorthanded time per game | 2:44 | 1:29 | Per-game rate |
| Power-play time (total) | 2 seconds | 19:24 | Total |
| Four-on-five chances against per 60, on ice | 15.23 | 9.55 | Rate |
| Five-on-five expected-goal share, on ice | 30.8% | 50.5% | Share |
| Five-on-five on minus off | -10.0 percentage points | -1.9 percentage points | Share difference |
| Distance per 60, all situations | 8.44 miles | 8.36 miles | Rate |
| Bursts over 20 mph per game, all situations | 1.00 | 1.23 | Per-game rate |
| Top skating speed through his first six games, all situations | 22.25 mph | At most 21.64 mph | Six-game maximum |
| Hardest shot through his first six games, all situations | 78.75 mph | 86.49 mph | Six-game maximum |
| Average shot speed, all situations | 65.65 mph | 66.57 mph | Average |
| Shots on goal per game, all situations | 2.0 | 2.0 | Per-game rate |
The legs and the shot#
NHL Edge gives little support to a sudden loss of skating ability. His all-situations distance per 60 is 8.44 miles across six games against 8.36 across Edmonton's 82. All-situations bursts over 20 mph have eased from 1.23 per game across those 82 games to 1.00 across these six. Through his first six games this season his top skating speed is 22.25 mph; through the same six-game stretch last season, nothing he skated reached 21.64.
The shot supplies the clearer change. Through his first six games in each season, his hardest shot across all situations fell from 86.49 mph to 78.75 mph. Across all situations, he has no attempts at 80 mph or harder in six games; last season's rate over 82 games would produce about 3.5 in six. His shot locations have changed alongside the speeds, without establishing a cause. Point shots account for three of his 12 shots on goal across all situations in six games, against 77 of 164 in Edmonton's 82.
Five-on-five#
Nurse's five-on-five expected-goal share in MoneyPuck's season files is 30.8 percent over 106.2 minutes, against 40.8 percent for San Jose with him off in his six games. Edmonton's corresponding shares last season were 50.5 on and 52.4 off across his 82 games. The on-minus-off gap has widened from -1.9 percentage points to -10.0, so the poor team environment does not explain away the whole split. San Jose's team share is 39.0 percent over 350.7 five-on-five minutes in seven games.
The card and the injury#
The 2025-26 card describes an Edmonton season, grading Nurse at -6.8 Pine Net Rating per 82 games, the 23rd percentile of 250 league defensemen and the third-pair tier. Its penalty-kill component was -4.28. The current rating uses different units, a season total, and cannot be compared numerically to that card. At -4.22 through six games, he ranks last in Pine Net Rating among 20 rated Sharks skaters and fifth-lowest among 684 league skaters.
Nurse is day to day with an upper-body injury suffered in the Oct. 13 loss to Boston, Sheng Peng reported for San Jose Hockey Now on Oct. 16. He was a full participant in Friday's practice, and Ryan Warsofsky told Peng of tonight's game at Detroit, "He's probably a game-time decision." The injury kept him out Oct. 15 at Nashville, leaving him at six appearances in San Jose's seven games.
The arguments against me#
- The sample can move sharply. San Jose allowed only one actual four-on-five goal with Nurse on the ice in 16.4 minutes, despite the poor expected result.
- The team has its own penalty-kill problem. San Jose allowed 11.01 four-on-five chances against per 60 over 39.1 minutes across seven games.
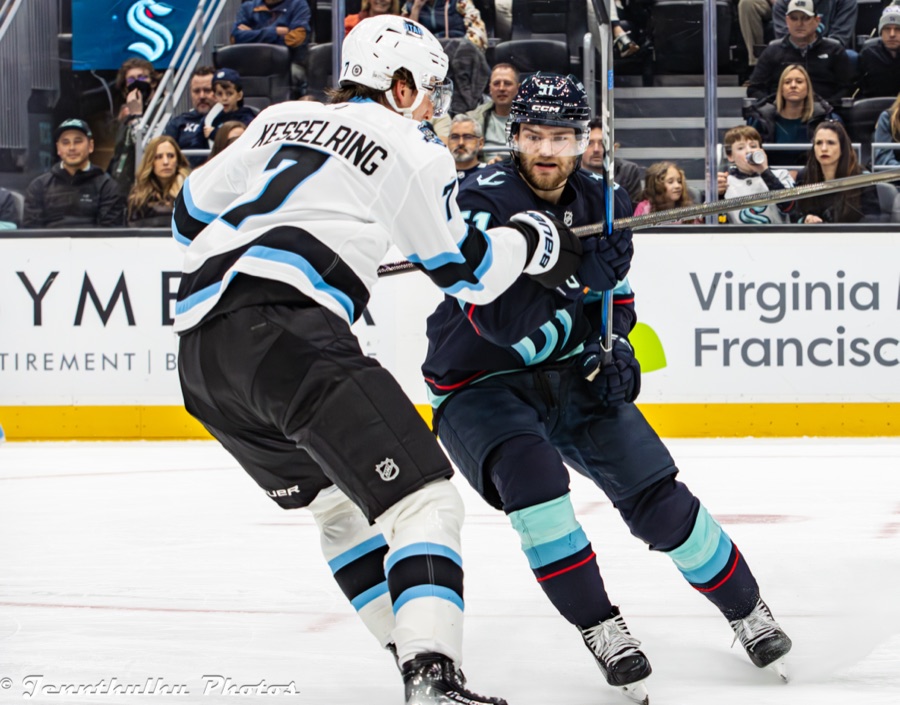
- The five-on-five evidence mostly describes a pair. MoneyPuck's line-combination file gives Nurse and Michael Kesselring a 28.6 percent expected-goal share in 86.7 minutes together out of Nurse's 106.2 minutes.
The allocation#
My open call has Sam Dickinson averaging more all-situations ice time than Nurse across San Jose's first 20 games, resolving Dec. 1. Nurse currently leads, 20:34 per game in six appearances against Dickinson's 18:41 in five. He is second among seven Sharks defensemen in average ice time, and more of that time than last season is spent a man down. The job that graded lowest on his card last season is now one where he plays 51.3 percent of San Jose's four-on-five minutes in his six games.
Sources: NHL Edge (2025-26 and 2026-27); the NHL's game logs, stats feed and game summaries; MoneyPuck's season, line-combination and game-by-game files (2025-26 and 2026-27); San Jose Hockey Now (Sheng Peng, Oct. 16).