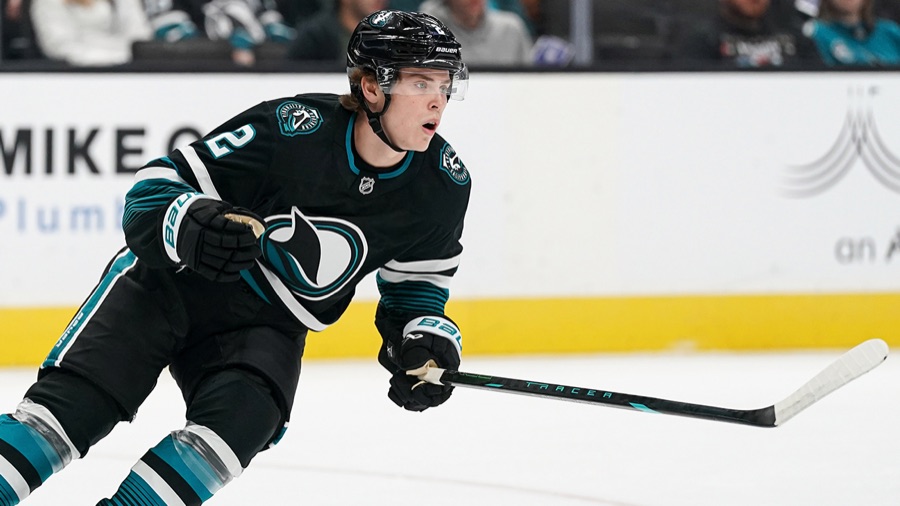
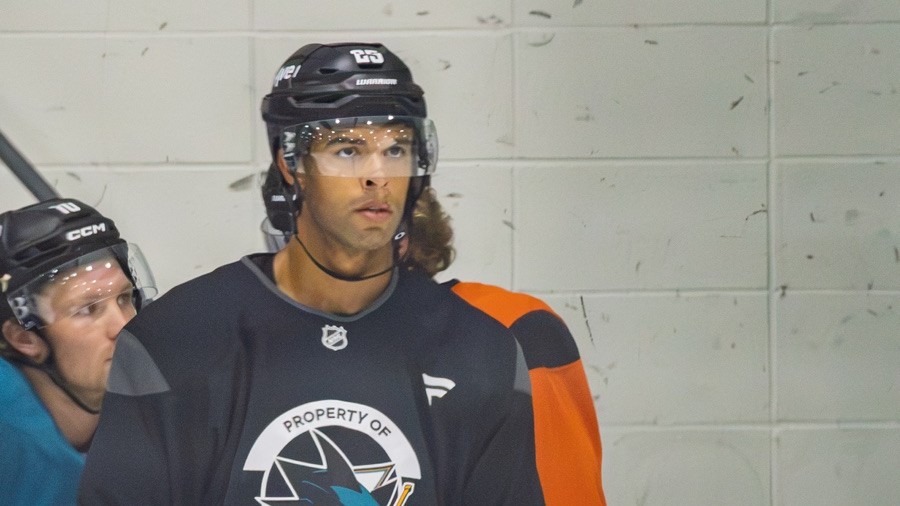
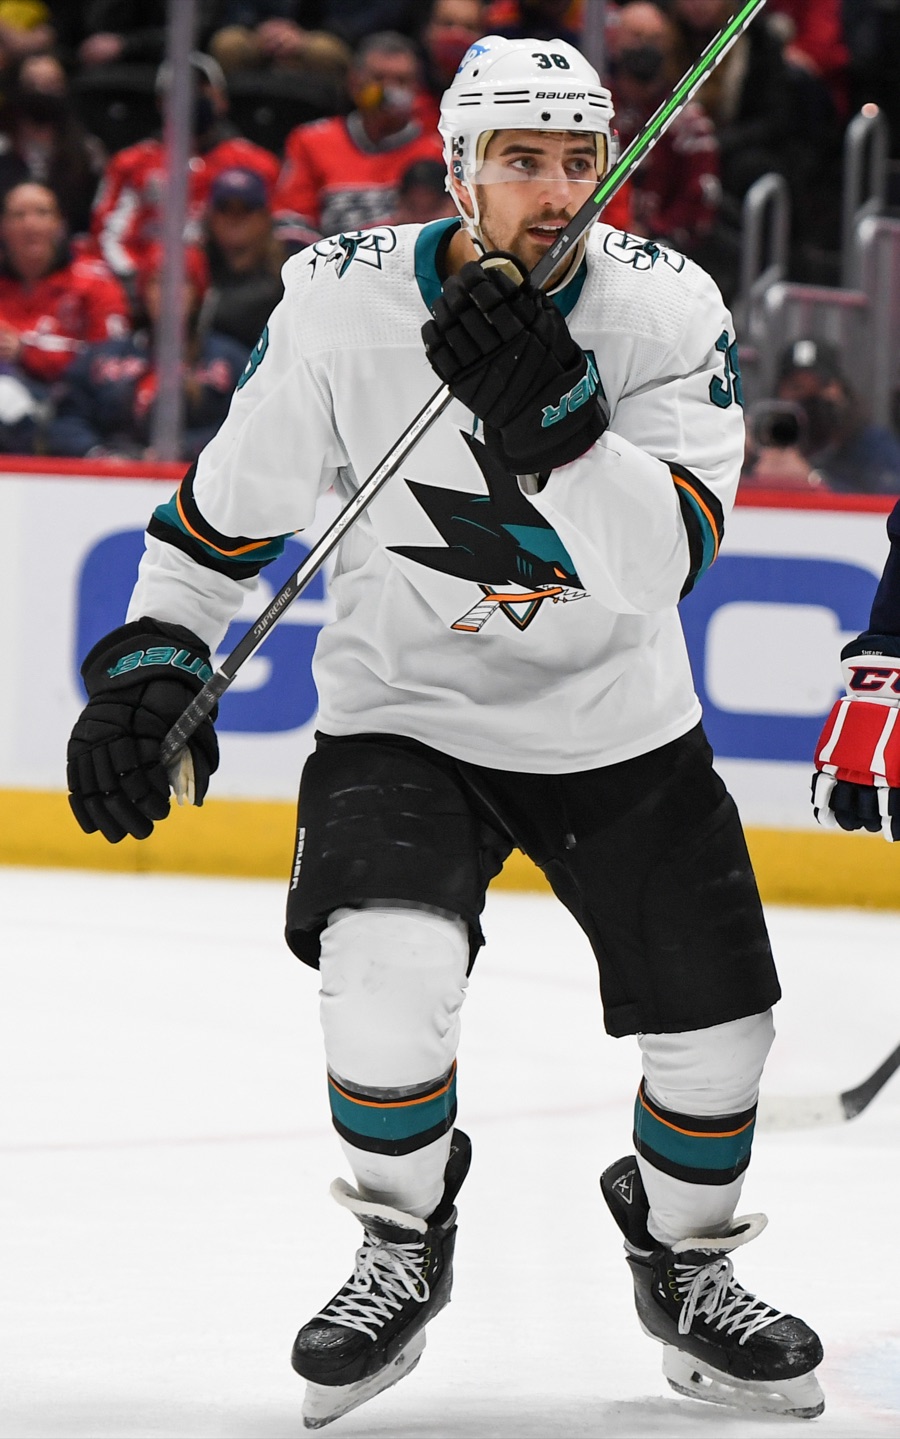
Trouba is a mile an hour slower than a year ago. His shot is not.
Jacob Trouba's fastest skate through eight games in San Jose is 19.67 mph, against 20.71 through his first eight in Anaheim last season. He still leads the Sharks' defensemen in ice time, and his shot has not slowed.

Jacob Trouba's fastest skate in eight games for San Jose is 19.67 mph, recorded in the second period at Detroit on Saturday. Through his first eight games for Anaheim last season, his fastest was 20.71. NHL Edge has not clocked him over 20 mph once this season.
This season is eight games in San Jose. Last season was 81 games in Anaheim. A top speed only rises as games are added, so the only maximum compared here is the one through the same eight-game window in each season. Everything else is a rate, an average or a percentile inside that season's own league pool.
The legs#
Edge's list of his ten fastest skates last season includes two from his first eight games: 20.71 mph on Oct. 11, 2025, and 20.44 on Oct. 16. Every faster entry on that list came later in the season. He is 32, and this season nothing in eight games has reached 20.
The burst counts point the same way. Last season he had 18 bursts over 20 mph in 81 games, about 1.8 for every eight games. This season he has none in eight, which puts him in the bottom one percent of this season's league pool on that count. Bursts between 18 and 20 mph have slipped from 1.78 a game to 1.50.
Distance per 60 minutes has moved with them. Across all situations he covered 8.26 miles per 60 last season, the 28th percentile. This season it is 8.04, the 7th percentile, against a league average of 8.53. At even strength the figures are 8.46 last season and 8.33 now, the 31st percentile and then the 13th.
| Measure | 2026-27, 8 games | 2025-26, 81 games (Anaheim) | Kind |
|---|---|---|---|
| Top skating speed through his first eight games | 19.67 mph | 20.71 mph (first eight games) | Maximum, same eight games |
| Bursts over 20 mph | 0 | 18 | Count |
| Bursts of 18 to 20 mph per game | 1.50 | 1.78 | Per-game rate |
| Distance per 60, all situations | 8.04 miles | 8.26 miles | Rate |
| Distance per 60, even strength | 8.33 miles | 8.46 miles | Rate |
| Average shot speed, all situations | 72.18 mph | 69.24 mph | Average |
| Shot attempts of 80 to 90 mph per game | 0.88 | 0.81 | Per-game rate |
| Shots on goal per game, all situations | 1.63 | 2.05 | Per-game rate |
| Time on ice per game, all situations | 21:50 | 22:50 | Per-game rate |
| Shorthanded time per game | 3:13 | 3:04 | Per-game rate |
| Share of his team's four-on-five minutes | 55.1% | 59.5% | Share |
| Five-on-five expected-goal share, on ice | 44.2% | 50.4% | Share |
| Five-on-five share, on ice minus off | +5.4 points | -2.5 points | Share difference |
The shot#
Nothing in the shooting numbers has declined. His average shot speed across all situations is 72.18 mph this season against 69.24 last season, the 80th percentile and the 72nd. Attempts between 80 and 90 mph come at 0.88 a game against 0.81. He has no attempts over 90 mph yet; last season's rate of 12 in 81 games works out to about 1.2 in eight.
There is no fair comparison for his hardest shot. None of his ten hardest shots last season came in his first eight games, so Edge offers no value for that window. He is putting fewer pucks on goal, 1.63 shots a game against 2.05, and 9 of his 13 have come from long range.
The minutes#
San Jose uses him more than any of its other six defensemen. He leads them in time on ice per game at 21:50, ahead of Darnell Nurse's 20:44, and in shorthanded time per game at 3:13. His total is down one minute a game from Anaheim's 22:50. Even-strength time fell further, 17:53 against 19:03, while his shorthanded time rose from 3:04 a game to 3:13.
The penalty kill is the job he already had. He has played 55.1 percent of San Jose's four-on-five minutes, 25.8 of 46.8, after 59.5 percent of Anaheim's last season. MoneyPuck's expected goals, called chances here, put San Jose at 11.21 chances against per 60 with him on the ice four-on-five, over those 25.8 minutes. The team's rate is 10.21 across 46.8 minutes, and his own rate in Anaheim was 9.11 over 238.1 minutes.
My open call has Trouba leading San Jose's defensemen in shorthanded time per game across the first 20 games, resolving Dec. 1. Through eight he leads Nurse by four seconds a game, 3:13 to 3:09, with Nurse at seven games.
Five-on-five#
The slower legs have not shown up in the chances yet. With Trouba on the ice at five-on-five, San Jose holds 44.2 percent of the chances over 139.0 minutes. With him off in the same games, it holds 38.9. The team's season share is 40.8 percent over 397.5 minutes.
Last season in Anaheim he was 50.4 percent on and the Ducks were just under 53 off, over 1,489.3 minutes, a gap of 2.5 points the other way. Chances against per 60 with him on have gone from 2.71 to 2.60. Most of his five-on-five time has come beside Sam Dickinson, 83.0 minutes at a 44.4 percent share.
The card#
His 2025-26 card describes the Anaheim season. It rates him at -11.4 Pine Net Rating per 82 games, the 10th percentile of 250 league defensemen and the third-pair tier. Its penalty-kill line, 9.11 chances against per 60, sat at the 8th percentile of 189 defensemen. This season's rating is a season total in different units, and the two cannot be compared as numbers. At -0.84 through eight games, he ranks 11th of 20 rated Sharks skaters.
The arguments against me#
- Eight games, and this is the real one. Last season's first-eight-games maximum is one skate on Oct. 11, 2025, and one skate of 20.71 mph or faster this season would erase the difference.
- The kill drags the distance. He plays 3:13 a game shorthanded, and his shorthanded skating covers 6.32 miles per 60 this season, well under his even-strength 8.33.
- The results do not show it. San Jose is 5.4 points better at five-on-five with him on than off, and his on-ice chances against per 60 are lower than last season's.
Sources: NHL Edge (2025-26 and 2026-27); the NHL's player pages, game logs, club stats and stats feed; MoneyPuck's season, line-combination and game-by-game files (2025-26 and 2026-27); the site's 2025-26 hockey card.