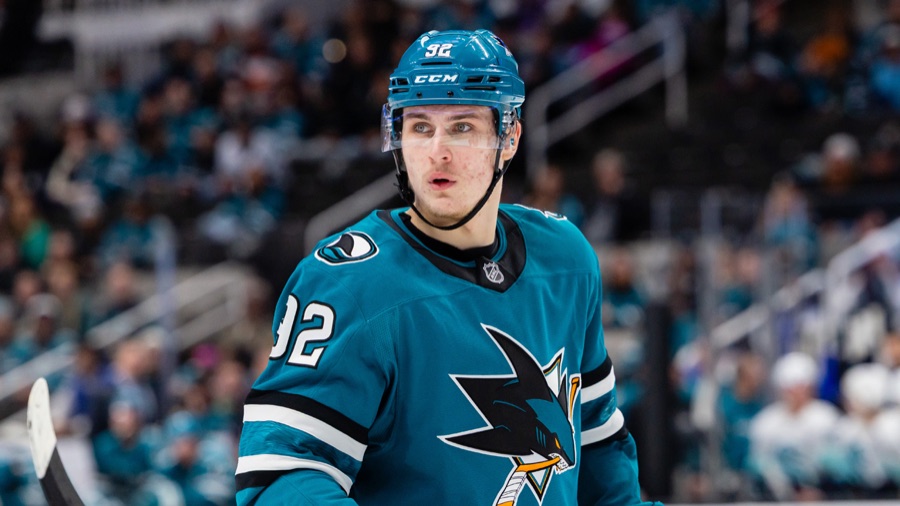
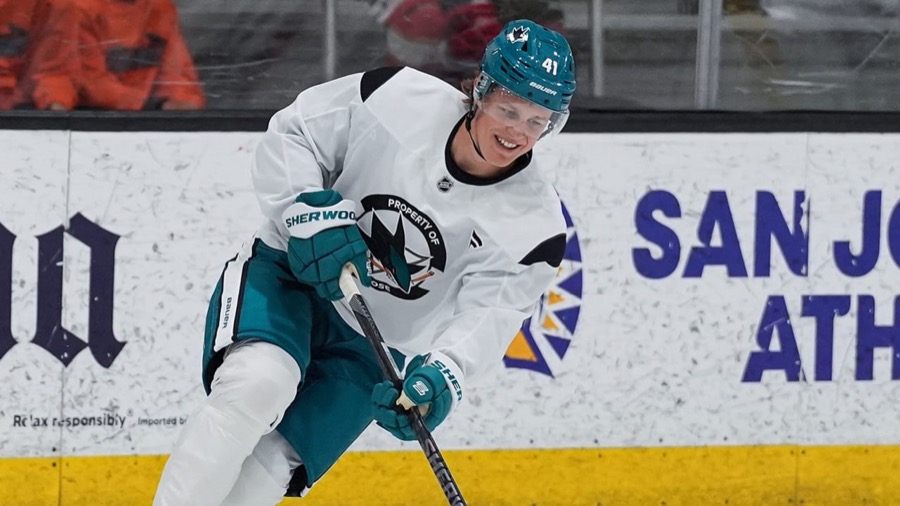
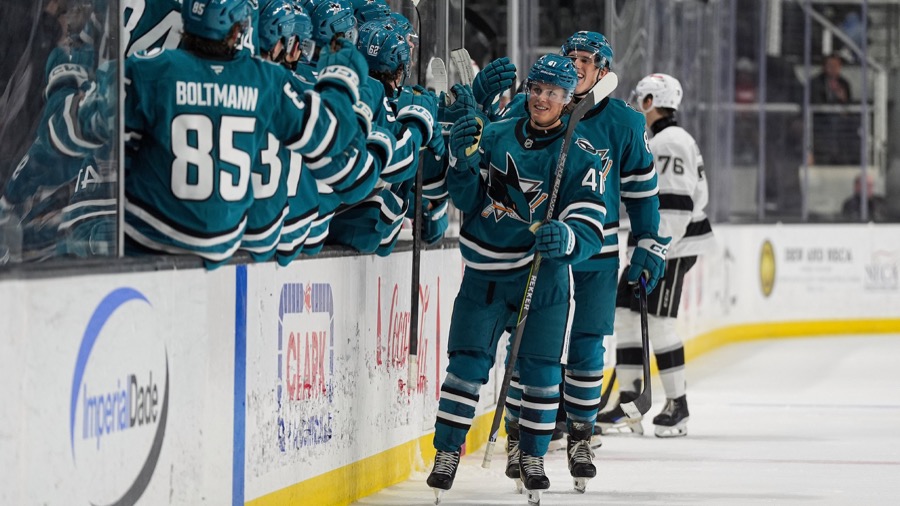
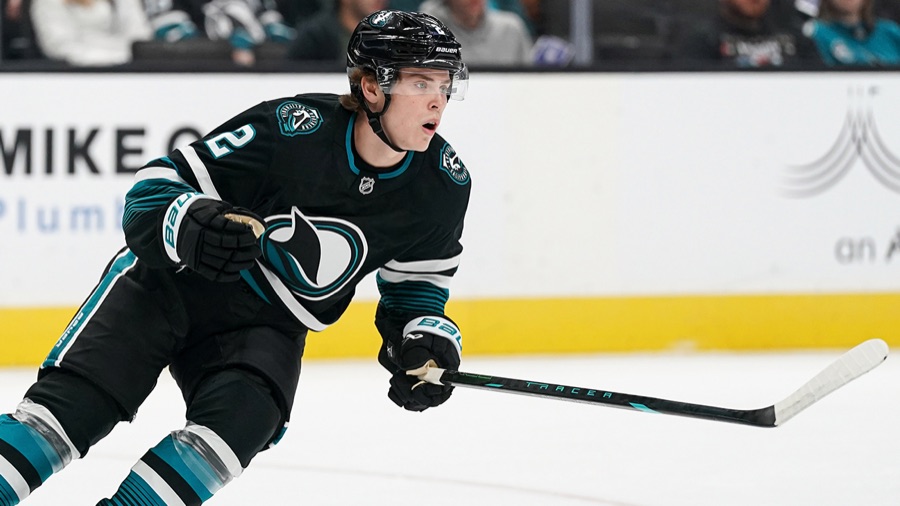
San Jose has held its own for three games. One line has not.
Over the last three games, San Jose took 59.7 percent of five-on-five expected goals in 93.6 minutes without Stenberg, Misa or Sherwood on the ice, and 31.7 percent in 44.2 minutes with any of them. Four road games follow, including the season's first back-to-back.
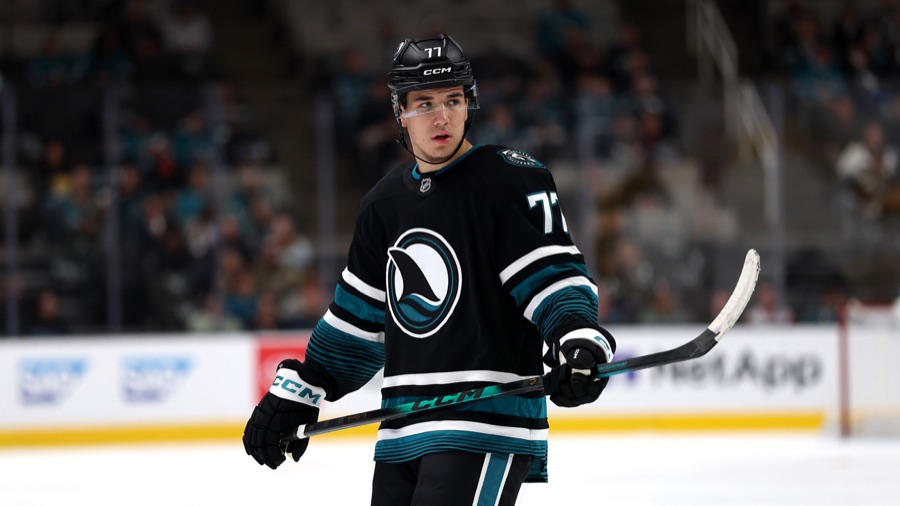
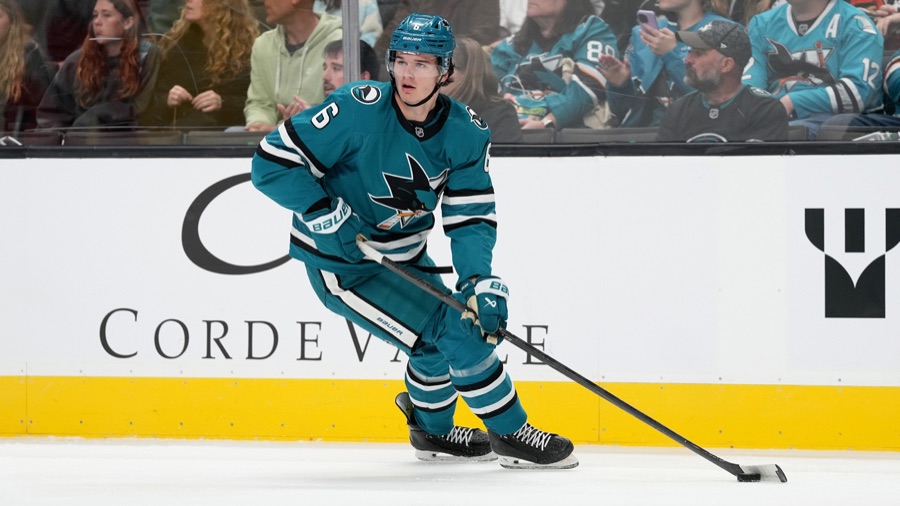
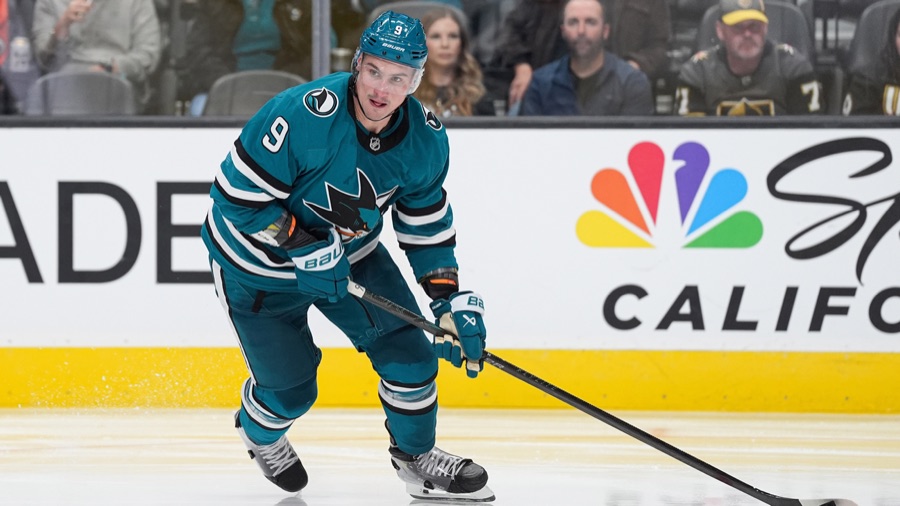
San Jose outscored opponents 3-1 at five-on-five over its last three games with Ivar Stenberg, Michael Misa and Kiefer Sherwood all off the ice, and was outscored 5-1 with any of them on. The rest of the lineup has been a team that wins its share of the chances, and the record has not caught up with either half.
Boston's 6-3 win, San Jose's 3-2 shootout win at Nashville and its 4-3 shootout loss at Detroit produced a 1-1-1 record. Across those games, the Sharks had 51.2 percent of five-on-five expected goals, 5.99 for and 5.70 against in 137.8 minutes. MoneyPuck's game data had them at 33.5 percent over their first five games, with 6.40 expected goals for and 12.70 against; its team game log puts the same five games at 34.2 percent. The season summary still has San Jose 29th of 32 clubs at five-on-five, at 40.8 percent on 12.39 for and 17.98 against; the season figure is MoneyPuck's team file and the splits are its game files.
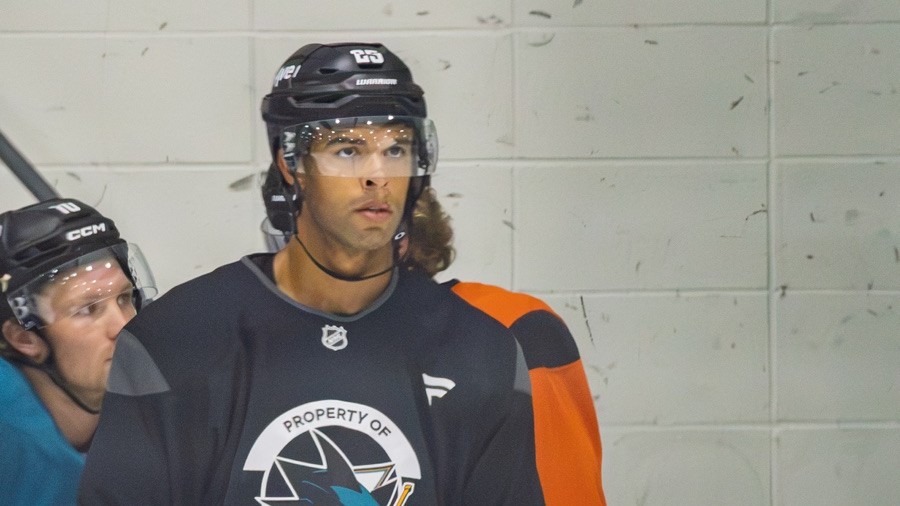
Every forward line changed at practice on Oct. 12, the day before Boston, as reported by San Jose Hockey Now and the Mercury News. Igor Chernyshov joined Macklin Celebrini and Will Smith, and that combination has taken 56.1 percent of five-on-five expected goals in 31.5 minutes since, outscoring opponents 2-0. The results have not moved with the share. San Jose has no regulation wins in eight games and was outscored 6-4 at five-on-five over these three.
The line split#
The Stenberg-Misa-Sherwood combination has fallen well below that improvement. The regulation five-on-five split from MoneyPuck's shots matched to NHL shifts separates minutes with nobody from the line present, anybody present, and the intact line.
| On the ice | Minutes | xG for-against | Share | Goals for-against |
|---|---|---|---|---|
| None of Stenberg, Misa or Sherwood | 93.6 | 4.88-3.30 | 59.7% | 3-1 |
| At least one of the three | 44.2 | 1.12-2.41 | 31.7% | 1-5 |
| All three together | 23.1 | 0.51-1.36 | 27.5% | 0-3 |
The bottom row's minutes are part of the middle row's, so the two are not separate samples. The middle row is the one that matters, because the trouble did not stay inside the shifts when all three were together. Stenberg and Sherwood were each on for five of San Jose's six five-on-five goals against in these games; Misa was on for three. Four of those five goals came against Boston, which gives the split a considerable Boston accent.
The earlier games point at the combination more than at any one of the three, with limits on how far two games can point. Stenberg and Sherwood were already linemates against Edmonton; Misa joined them at practice on Oct. 12. The league's shift charts return no rows for the opening three games, so the available earlier on-ice comparison covers only games four and five, St. Louis and Edmonton.
In those games, Sherwood's five-on-five share was 52.8 percent in 27.4 minutes, Misa's 46.4 percent in 24.2, and Stenberg's 44.2 percent in 28.3. Each was above San Jose's five-on-five share of 41.3 percent, built on 3.11 expected goals for and 4.42 against across those two games.
The arguments against me#
- The sample is 44.2 five-on-five minutes with any of them present and 23.1 together across three games. Boston supplied four of the five goals against with Stenberg and Sherwood on the ice, enough for a bad game to dominate the reading.
- Quality of competition and zone starts were not measured for this line. Its minutes may have been harder than the rest of San Jose's minutes.
- Nashville went the other way. The intact line led 0.32 to 0.24 in five-on-five expected goals over 6.9 minutes, the one game of the three in which it was ahead.
The first objection is the real constraint on blaming the combination, because the intact line's entire five-on-five case covers 23.1 minutes across three games.
The standings#
Points percentage is the measure here because Western clubs have played six to ten games. San Jose's .562 ties Dallas and Nashville behind Anaheim's .571 for the last wild-card place, but regulation wins are the first tiebreaker: Dallas and Nashville have three each, San Jose none, leaving the Sharks 11th of 16 in the West by points percentage. All four wins came after regulation, and five of eight games went beyond 60 minutes.
Four on the road#
The remaining four games of the six-game trip begin at Toronto on Monday at 4:30 p.m. Pacific and Montreal on Tuesday at 4 p.m. This is San Jose's first back-to-back after eight games without consecutive dates. The NHL goalie summary has Yaroslav Askarov at an .848 save percentage on 132 shots in five starts this season and Alex Nedeljkovic at .920 on 87 shots in three starts.
Toronto presents an awkward assignment for San Jose's power play. The Sharks have six goals in 26 opportunities this season; Toronto's penalty kill has surrendered one in 28 times shorthanded, though at five-on-five the Leafs are 27th of 32 at a 44 percent expected-goal share. Montreal brings a stronger five-on-five test, ranked seventh of 32 clubs in the MoneyPuck season file at a 54 percent expected-goal share.
Ottawa follows Thursday at 4 p.m. with a season power play of five goals in 39 opportunities. Saturday at 4 p.m. brings Boston again, now on five straight wins, and another chance to see whether San Jose's improvement can survive the opponent that supplied so much of the line's damage. Boston's season five-on-five goals stand at 22 for and 11 against through nine games.
Sources: NHL standings, club schedule, gamecenter boxscores, shift charts and stats API team and goalie reports for 2026-27; MoneyPuck game data and 2026-27 team season file; practice lines as reported by San Jose Hockey Now and the Mercury News.