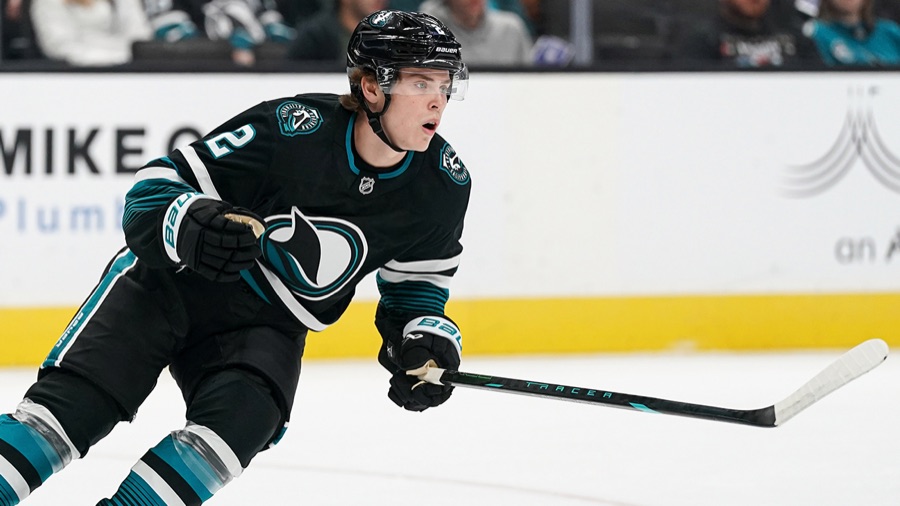
Misa has easier starts, but the chances are going the other way
Michael Misa's points and shots match his opening stretch last season. His five-on-five deployment has changed much more than the box score suggests.
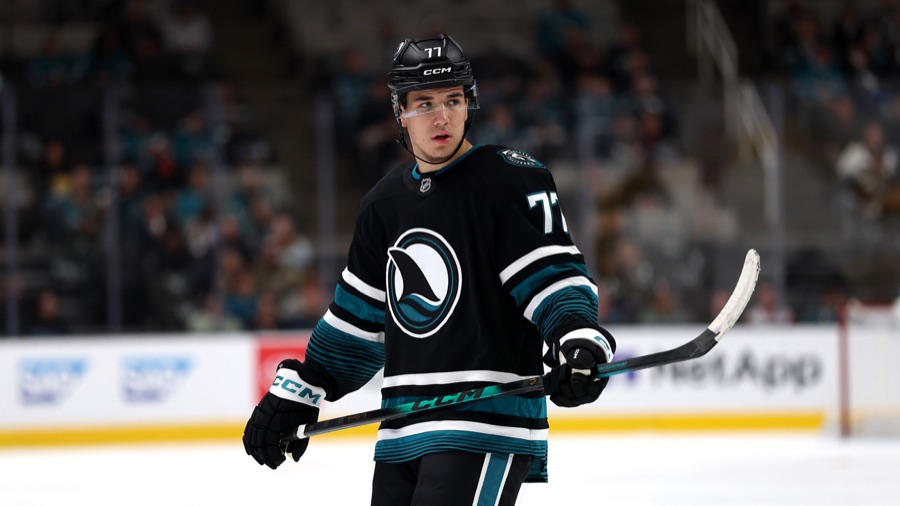
Michael Misa is starting fewer shifts in his own end, and San Jose is getting a smaller share of the chances with him on the ice. Through five games and 61.2 minutes at five-on-five in 2026-27, his defensive-zone faceoff starts have fallen from 6 of 24 through the same five games last season to 2 of 31, while his on-ice expected-goal share has fallen to 31.6 percent.
His opening five games in each season produced the same line in the NHL game logs: three points and four shots on goal, all situations. The scoring ingredients differ, with three assists this season against a goal and two assists last season. The ice time has grown, too, from 12:22 per game in that opening stretch of 2025-26 to 13:50 across all situations in this season's five games.
The starting point#
MoneyPuck's game-by-game and season files count shifts beginning with a faceoff by zone. That denominator matters because it includes neutral-zone starts; it does not describe every shift Misa takes. Through his opening five games last season, he began 6 of 24 such five-on-five shifts in his own end, or 25.0 percent. This season's defensive share is 6.5 percent of 31 faceoff starts.
Nobody has supplied a reason for the change, and the counts cannot supply one themselves. The current deployment sits below either version of last season, including the full 45 games, when 60 of his 223 five-on-five faceoff starts came in his own end, 26.9 percent.
| Measure and situation | 2026-27, five games | 2025-26, first five games | 2025-26, all 45 games |
|---|---|---|---|
| Ice time per game, all situations (min:sec) | 13:50 | 12:22 | 12:49 |
| Defensive-zone faceoff starts, five-on-five (count/total faceoff starts) | 2/31 | 6/24 | 60/223 |
| On-ice expected-goal share, five-on-five (percent) | 31.6 | 50.4 | 49.7 |
| Ice time, five-on-five (minutes) | 61.2 | 51.2 | 514.7 |
| Individual shot attempts, five-on-five (per 60 minutes) | 3.9 | 11.7 | 10.1 |
| Top skating speed, all situations (mph; opening five games only) | 22.55 | 21.90 | Not compared |
The expected-goal figures use MoneyPuck's model to describe the chances while Misa is on the ice. Easier starts have accompanied less offense and more danger against, without establishing that deployment caused either change. His five-on-five expected-goal share is 31.6 percent in 61.2 minutes this season, against 50.4 percent in 51.2 minutes through his first five games last season.
The missing attempts#
Misa put four shots on goal against Florida on Oct. 1, then none in the four games since, across all situations. At five-on-five, his own attempts have dropped from 10 in his opening 51.2 minutes last season to four in 61.2 minutes this season. Those include attempts that do not reach the goalie, so the shortage begins before anybody has to make a save.
The territorial figures give the starts some useful company. NHL Edge's even-strength zone-time table has Misa spending 37.3 percent of his time in the offensive zone through five games this season, against 38.5 percent over 45 games last season. A faceoff further from his net has not yet meant spending more of the shift near the other one. His defensive-zone time has edged upward instead, from 43.9 percent of even-strength time over last season's 45 games to 44.4 percent through this season's five.
The skating#
The skating rates show little change in distance covered. NHL Edge has Misa at 10.26 miles per 60 minutes across all situations through five games, against 10.17 over last season's 45; bursts above 20 mph have declined from 10.6 to 7.8 per 60, with only nine recorded this season. That burst count cannot carry much of an argument about his legs.
The comparable maximum does support Sheng Peng's observation, published Oct. 4 at San Jose Hockey Now, that Misa is "noticeably faster this season." Edge's all-situations maximum rose from 21.90 mph through his first five games last season to 22.55 mph through five this season.
The arguments against me#
Three arguments cut against reading the chance share as Misa going backward.
- The team, and this one is real. San Jose without Misa has a five-on-five expected-goal share of 35.2 percent through these five games, down from 49.0 percent through his opening five last season. Most of the decline belongs to the team around him. Misa is 3.6 percentage points below the Sharks without him this season, against 1.4 points above through the same five games last season.
- The passing. All three assists this season are primary assists at five-on-five. MoneyPuck credits him with as many primary assists in these five games as in all 45 games last season. His reduced shooting has arrived alongside passes that directly precede goals.
- The goals. The chance deficit covers 61.2 five-on-five minutes across five games. The actual goals with him on the ice have favored San Jose, five for and four against in those minutes.
The older portrait#
The 2025-26 hockey card placed Misa in its third-line tier, with defense in the 12th percentile among 469 league forwards after 45 games. That is last season's portrait; this season's rating does not exist yet.
For San Jose, more attempts from Misa would make the easier starts look more productive. His five-on-five attempt rate was 10.1 per 60 minutes over last season's 514.7 minutes, against 3.9 over this season's 61.2 minutes.
Sources: NHL Edge (both seasons); the NHL's game logs and stats feed; MoneyPuck's season and game-by-game files; Sheng Peng at San Jose Hockey Now (Oct. 4, 2026).
This season's Pine Net Rating does exist. Since Oct. 4 it has rated 2026-27 play against last season's replacement level, until this season's own baseline has enough players.
GSP