Six Of Igor Chernyshov's Twenty Eight Games Ended With No Shot On Goal
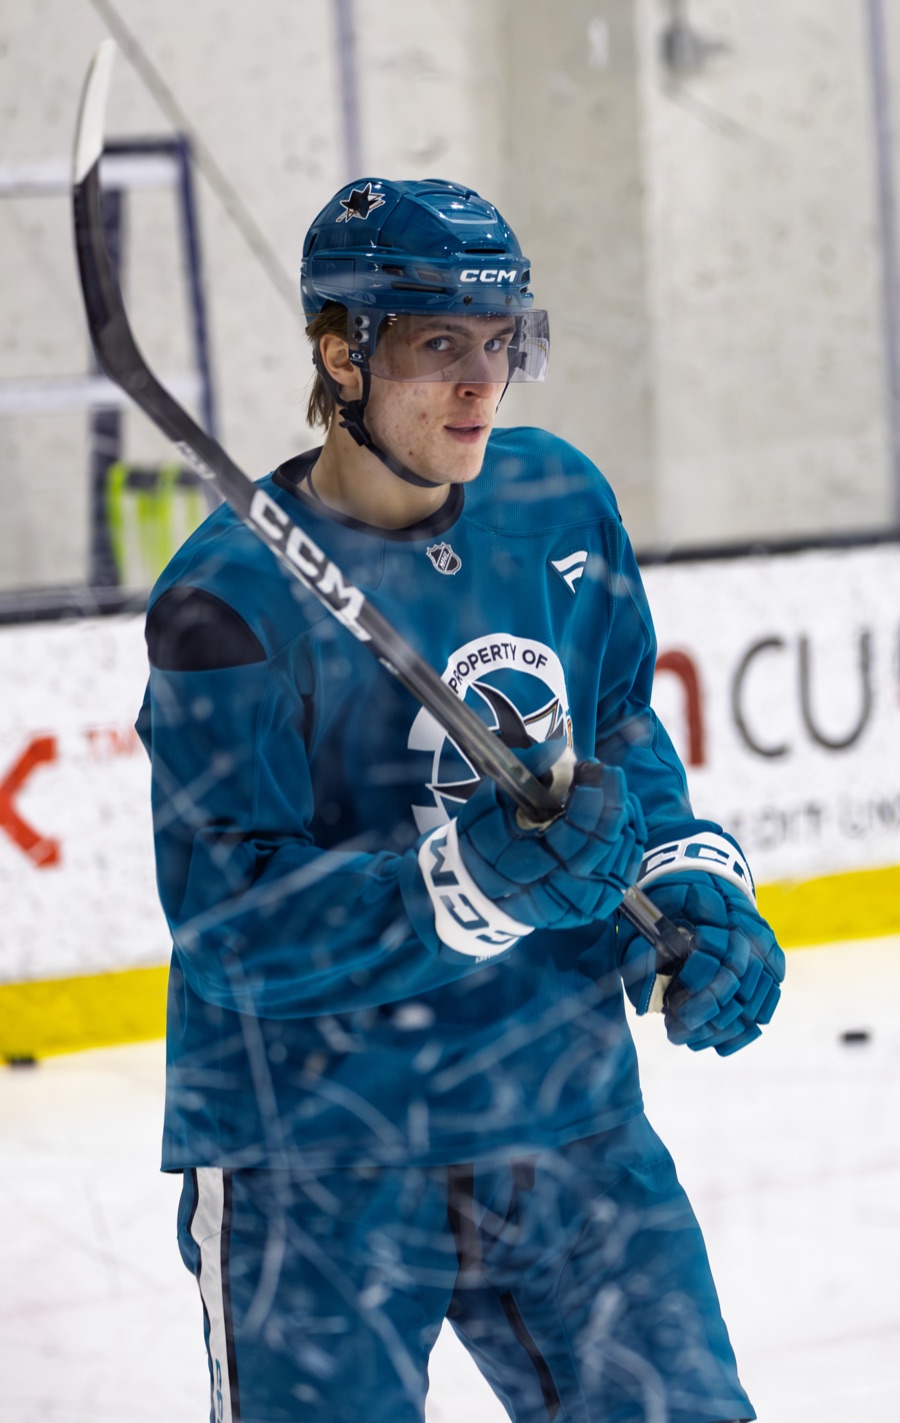
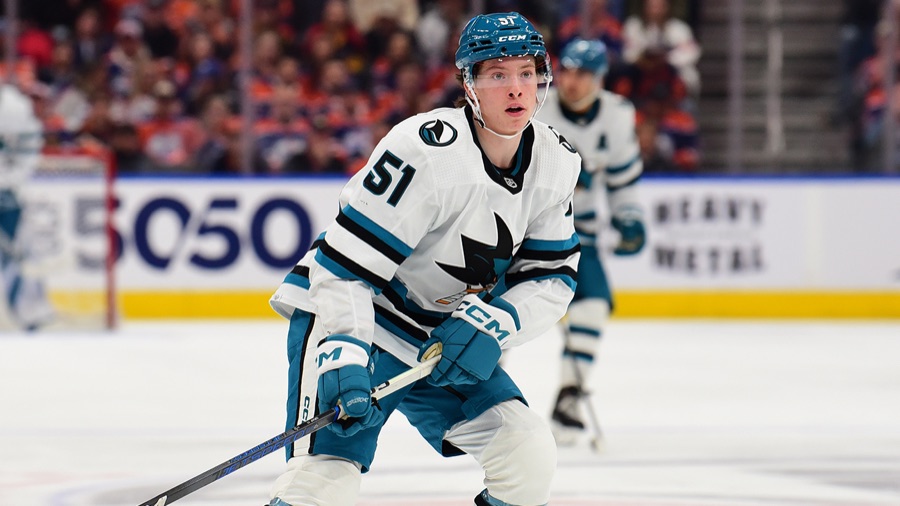
The Sharks 25, No. 9. Chernyshov shot from better places than almost any forward in the league last season and got fewer of those attempts to the goalie than the model expected from them. Nine goals came out of twenty eight games anyway, and San Jose's second scoring line is waiting on the gap between how good his chances are and how rarely he takes one.
Take the nineteen forwards who dressed for San Jose last season. Sort them by shots on goal per sixty minutes. Read down from the top.
Macklin Celebrini is first, at 9.85. Tyler Toffoli is second. Will Smith is fifth. Igor Chernyshov is ninth, at 6.55, between William Eklund and Michael Misa, on a team that scored 249 goals and allowed 290.
Now sort the league instead. Among the 426 forwards who played at least 400 minutes in 2025-26, Chernyshov ranks 189th in shots on goal per sixty. On the same list of the same 426 men, he ranks 19th in expected goals per unblocked shot attempt.
Nineteenth in how good the shot is. One hundred and eighty ninth in how often he takes one. That gap is his season, and it is why he sits ninth in this series rather than fifteenth or fourth.
The attempts that did not arrive#
Chernyshov put 81 shot attempts on the board in 28 games. Forty six reached the goaltender. Ten were blocked. Twenty five missed the net entirely.
Twenty five of 71 unblocked attempts is 35.2 percent, and on its own that is unremarkable. Those 426 forwards missed on 34.4 percent of theirs collectively. He is league average at missing.
He is not league average at where he shoots from, which is what makes the number worth reading. MoneyPuck's model expects an average shooter, from the places Chernyshov shot from, to put roughly 57 of those 71 on net, because shots from the low slot miss less often than shots from the wall. Forty six arrived. That gap is the widest of any San Jose forward who played 400 minutes and 32nd widest among the 426.
So fewer of his attempts reached the goalie than his shot selection called for, not more.
Where the nine goals came from#
He debuted on December 16 and played fifteen games through January 19. Twenty seven shots on goal, three goals, eight assists.
He dressed again on March 14, played 28 seconds, took no shots, and did not appear in another game for ten days.
Then twelve games to close the season: nineteen shots on goal, six goals, two assists.
Twice the goals of the first stint, on eight fewer shots. Six of nineteen is 31.6 percent, a rate nobody holds across a season, and it arrived alongside his lowest sustained shot volume of the year. His shooting percentage finished at 19.6, second among the nineteen and behind only Pavol Regenda's 24 games.
The goals themselves were earned. Nine came against 8.12 expected goals, so the chances were worth roughly nine to an average shooter. He took a small number of very good looks and buried close to what they were worth.
The arithmetic underneath is the part worth holding onto. Shots on goal is the denominator of shooting percentage. Miss the net less often and that denominator grows, so the same nine goals divide into a bigger number and the percentage falls while the goal total climbs. Had he hit the net at the rate his locations predicted, nine goals across 57 shots is 15.7 percent, and nobody would call that unsustainable.
The three arguments against me, and the first one is real#
One. His job was net front. He spent most of his minutes on Celebrini's off wing at 6'2" and 195 pounds, parked in the low slot, and a deflection that sails wide is not the same mistake as a wrist shot that sails wide. The model prices location, not intent. A tipper misses more than his coordinates suggest and is doing his job correctly.
Two. Twenty eight games. Seventy one unblocked attempts is thin for a miss rate, and one cold month inside it moves the number more than a habit would.
Three. His finishing needed no repair. Nine goals against 8.12 expected is a player already converting at the model's price, so the case for volume assumes a wider shot diet converts at the same rate. Good spots may be exactly why there are so few of them.
Best case and worst case, for the club#
San Jose's best case is that the volume moves and the top line stops being the only place Chernyshov works. A winger taking three shots a night from the locations he already favours is a second scoring line, which is the thing this roster does not have and the reason Michael Misa's leap matters. It also lets Ryan Warsofsky move Toffoli or Mason Marchment out of the top six without losing goals.
The worst case for San Jose is not that he stops scoring. It is that he stays where he was. Six of his 28 games ended with no shot on goal at all, and a winger at 1.64 shots a night is a passenger beside Celebrini and a fourth option away from him. If the finishing falls toward normal and the volume does not rise to meet it, the goal total drops twice, and the Sharks keep a 34-year-old in the top six because the 21-year-old did not take the job.
What to watch, October#
Shots on goal per game, against a baseline of 1.64. That is the whole reading and it takes ten seconds on any box score.
Watch the shot-attempt column beside it. Attempts up and shots on goal flat means the volume came and the accuracy did not. Both up means the season is happening.
Then power-play time. San Jose gave him 1:08 a night last season, 30 minutes and 47 seconds in total, and he scored three goals in it. Professor Hockey's August 28 opening-night board has him on the second unit with Misa, Michael Kesselring, Ivar Stenberg and Kiefer Sherwood. If that holds, his minutes rise in the one situation where a shooter picks his spot.
The stakes#
San Jose has missed the playoffs for seven straight seasons. The last berth was 2018-19.
Chernyshov was the 33rd pick in 2024 and costs $934,167 this season and next. San Jose spent the summer paying Marchment $6,750,000 a year, and Darnell Nurse and Jacob Trouba $17,500,000 between them, to make the lineup deeper. The cheapest version of the same thing already sits 19th in the league in the quality of the shots he takes and 189th in how many.
Yesterday: Collin Graf scored more shorthanded than he did on the power play.
Sources: The NHL's own skater summary, time-on-ice-by-strength database and game log for San Jose's 2025-26 season, read September 9, for every games-played, ice-time, scoring and shots-on-goal figure here and for the game-by-game splits. MoneyPuck's 2025-26 season skater file, same date, for shot attempts, missed shots, expected shots on goal and expected goals, and for every league rank quoted, all of them computed across the 426 forwards who played at least 400 minutes. PuckPedia and the club's cap sheet for contract term and cap hit. Professor Hockey, August 28, for the projected opening-night power-play units, which are his.