San Jose Needs Sixty Six Goals And Its Goaltender Can Find Half Of Them
Fifth place in the NHL paid 106 points last season and the Sharks had 86. Priced properly, the goaltending is worth ten of the twenty, the penalty kill is worth three, and the power play everybody wants fixed is worth about one.
Open the final 2025-26 NHL standings and count down to fifth place. It is Tampa Bay, 106 points. Montreal finished sixth on the same number.
Now find San Jose. Thirty-nine wins, thirty-five regulation losses, eight overtime losses, 86 points, twenty-fourth of thirty-two.
That is the whole question written as arithmetic. Twenty points.
What twenty points costs#
Points and goal differential move together, and last season they moved at a fixed rate. Fit a straight line to all thirty-two teams, differential on one side and points on the other, and the slope comes out at 0.3008 points for every goal. The line explains about ninety percent of the spread between the best team and the worst.
Invert it and a standings point costs 3.3 goals. Twenty points cost 66.
San Jose was minus 41 on the season, 249 goals for and 290 against. Sixty-six goals of improvement puts the club at roughly plus 25.
One note on the currency. The 2026-27 schedule is 84 games, two longer than last season's. Tampa Bay's 106 points at the same nightly rate reads about 109 on next season's table. Everything below is priced in the 82-game season both teams actually played.
The shape of a top-five team#
Look at the five clubs that finished above the line and read their goal columns rather than their point totals.
Colorado scored 298 and allowed 197. Carolina 291 and 236. Tampa Bay 286 and 229. Buffalo 283 and 240. Dallas 273 and 222.
Not one of the five scored fewer than 273. Not one allowed more than 240.
San Jose scored 249, seventeenth, and allowed 290, thirtieth. The ask is a top-six offense and a top-ten defense in the same year, and any list of conditions that does not add up to both of those is a list that stops short.
The crease#
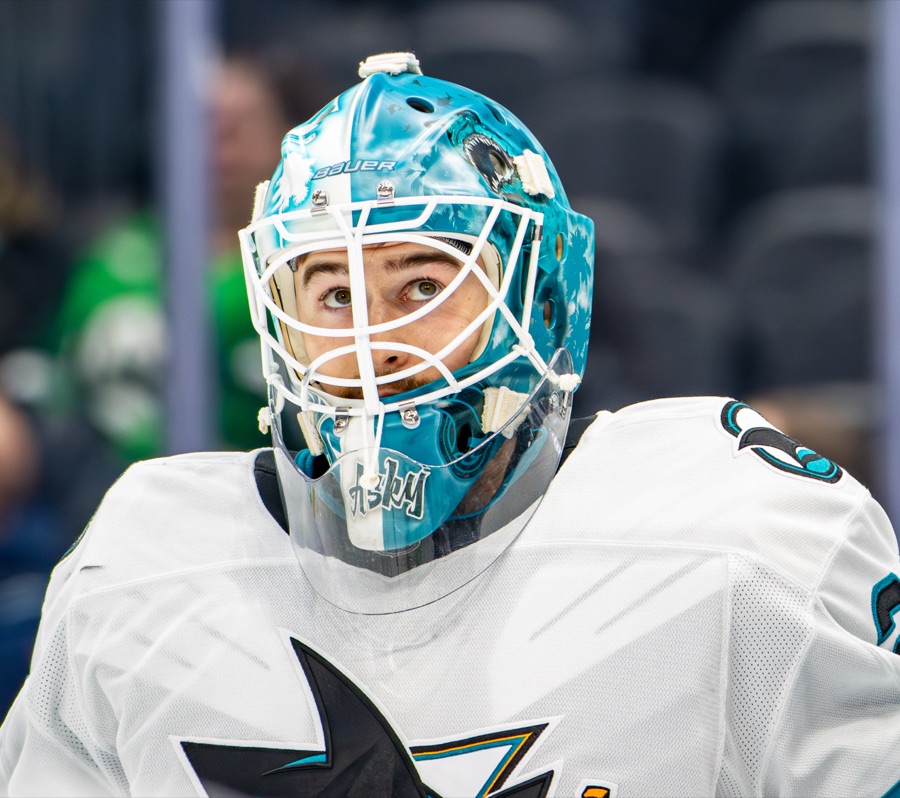
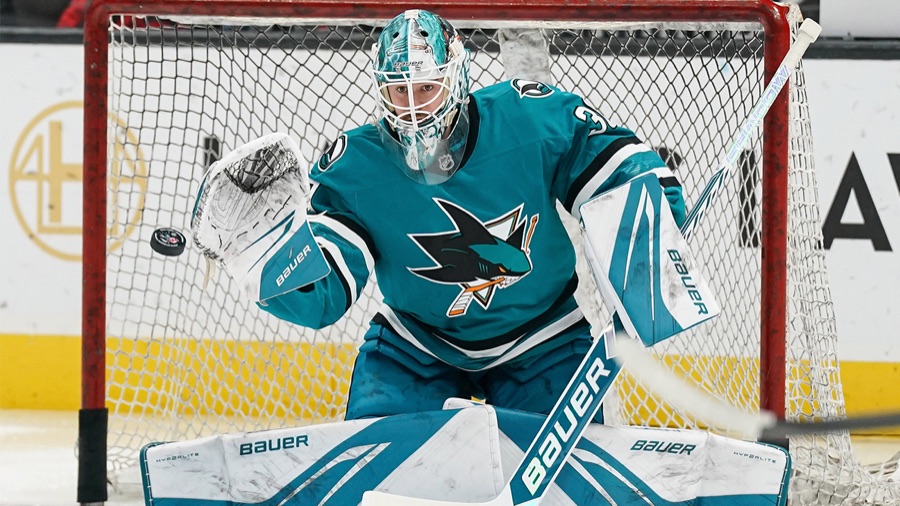
Yaroslav Askarov started all forty-seven games he appeared in and faced 1,341 shots. He allowed 157 of them. That is a save percentage of .884.
Of the fifty-three goaltenders who made at least twenty-five starts last season, he ranked forty-third.
Tenth in that group was Philipp Grubauer at .909. Hold Askarov's shot volume where it was, move his save percentage to Grubauer's, and the arithmetic gives back 33.7 goals. At 3.3 goals a point, that is ten points in the standings, from one man, with nothing else on the roster changing.
Half the gap. From the goalie.
Two things about that number before it gets used for more than it is worth.
The first is how far it still leaves the club. Take those 33.7 goals off the ledger and San Jose allowed 256, which would have ranked twenty-third. Ten points and a bottom-ten defense at the same time. That is the size of the hole.
The second is that it cannot be added to a better blue line. If the defensemen in front of him cut the shot quality, Askarov's save percentage rises without Askarov doing anything, and the same goals get counted twice. The goaltending case and the top-pairing-defenseman case are substitutes, not additions, and only one can be paid for at a time.
For scale at the other end of the same lever: every goaltender in the league combined stopped .8955 of what they faced, and moving Askarov to merely that is 15.9 goals and about five points. Alex Nedeljkovic, in the same building and the same shot environment, stopped .896 across thirty-four starts.
The goaltending is worth more than both special teams together, three times over
What each fix returns in standings points, priced at San Jose's own 2025-26 volumes: 1,341 shots faced by Yaroslav Askarov, 255 power-play chances, 246 times shorthanded. Goals converted to points at 0.3008 points per goal, the slope of points against goal differential across all thirty-two teams last season. Bars run from zero to twenty points. Teal marks the gap being closed.
One point#
San Jose's power play converted 21.18 percent, sixteenth in the league, on 255 chances. Only five clubs drew more.
Twelfth place belonged to Detroit at 22.58 percent. Move San Jose from sixteenth to twelfth across those same 255 chances and the club scores 3.6 more goals. That is a shade over one standings point.
The power play is the most talked-about repair on this roster and it is the smallest one available. To get five points out of it San Jose would have to convert at 27.7 percent, which last season would have been third in the NHL and nearer to second than to fourth. That is not a fix. That is Edmonton.
There is a harder version of the same finding sitting in the top-five teams themselves. Their power plays ranked second, fourth, seventeenth, twenty-first and twenty-seventh. Three of the five best teams in hockey ran a worse power play than San Jose did. Colorado won 121 points with the twenty-seventh-best power play in the league.
The special team nobody lists#
Their penalty kills ranked first, third, fourth, eleventh and thirteenth. Every one of the five killed at 80.32 percent or better.
San Jose killed at 76.42 percent, twenty-sixth, on 246 times shorthanded, the eleventh-heaviest workload in the league. Fifty-eight power-play goals went in behind it.
Twelfth on the kill was Calgary at 80.41 percent. Move San Jose there across the same 246 kills and it is 9.8 goals, about three points. Nearly three times what the power play is worth, on a unit that appears on nobody's list of what has to change.
Five teams is five teams and not a law of the sport. But the pattern in those five is the opposite of the one the conversation assumes: the power play is where good teams differ from each other, and the kill is where they look alike.
Rates, not totals#
Will Smith scored 59 points. He played 69 games to do it, which is 0.855 a night.
Run that exact rate across a full 84-game season and it is 72 points. Not a leap. Not a step forward. The same player, available.
Asking Smith for the low eighties is asking for a point a game, a seventeen percent jump on top of full health, which is a top-twenty scorer's season. Asking him for seventy-five is asking for health plus a seven percent improvement, and that is a request a reader can believe.
Michael Misa scored 21 points in 45 games, 0.467 a night. Sixty points across 84 games is 0.714. That is a fifty-three percent rate increase from a player entering his second year, and it has to happen in second-line minutes, which is the deployment that caps it.
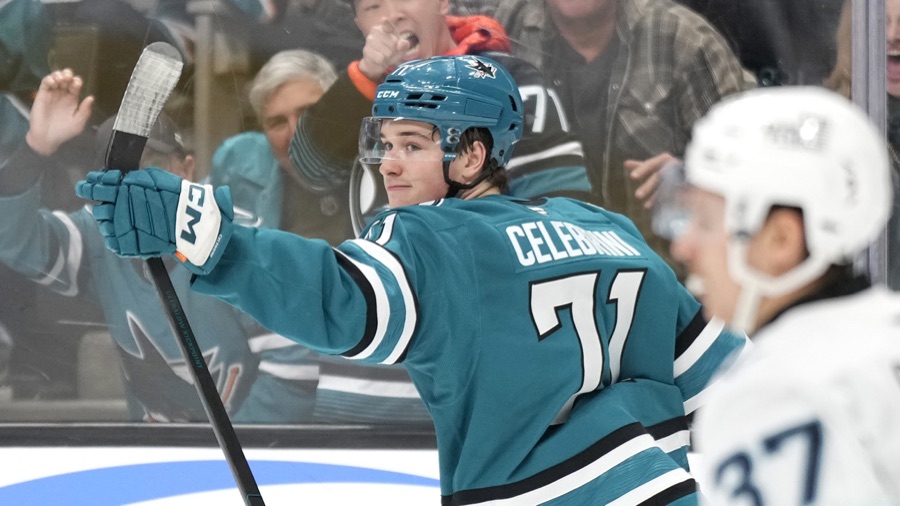
Macklin Celebrini scored 115 points. The next-highest Shark scored 59. Take all thirty-two clubs, subtract each one's second-leading scorer from its leading scorer, and San Jose's 56 is the biggest gap in the league, ahead of Tampa Bay at 42 and Edmonton at 41. That is a roster with no insulation at all. Celebrini repeating 115 is not a condition on a top-five season, it is the floor underneath every other condition, and there is no version of this that survives him missing twenty games.
The blue line has no vacancy#
The power-play quarterback argument assumes a job is open. Read the depth chart instead.
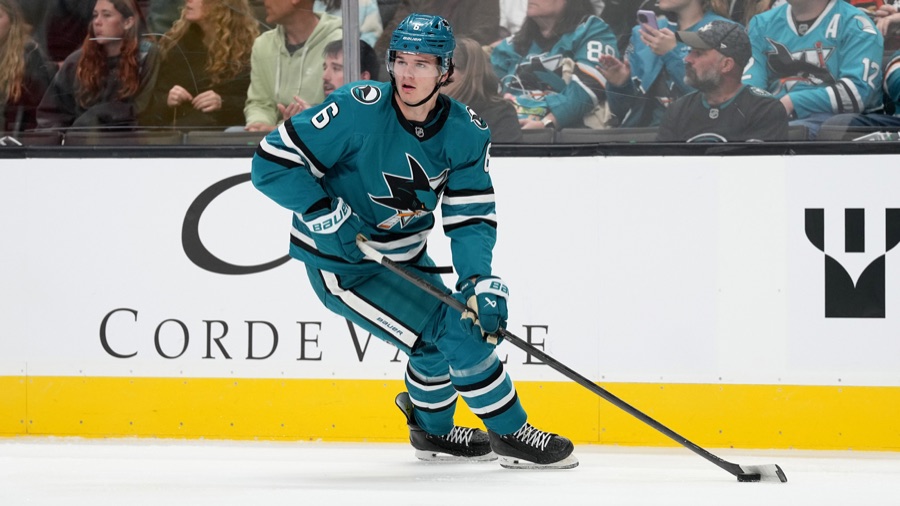
Seven defensemen are in line for six spots: Jacob Trouba, Darnell Nurse, Dmitry Orlov, Michael Kesselring, Sam Dickinson, Nolan Allan and Luca Cagnoni. Trouba, Nurse and Kesselring all arrived on multi-year deals inside the last three months, and none of the three signed to sit.
Five of the seven dressed for at least thirty-four NHL games last season. Nurse and Orlov played all 82, Trouba 81, Dickinson 72, Kesselring 34 in an injury-wrecked year in Buffalo. Allan played none, in the AHL all season.
Cagnoni played three. He scored no points in them.
The man he is supposed to replace, Orlov, put up 18 power-play points last season, more than any other San Jose defenseman by nine, and did it while playing all 82 games. Dickinson played 72 games as a nineteen-year-old and finished with zero power-play points, because the staff gave him almost no power-play time to have them in.
Cagnoni does not need to be a good power-play quarterback. He needs to be defensible enough at even strength that a coach with six other options dresses him. That is the problem that decides whether the power-play argument ever gets tested.
What is already on the board#
Four open rows on this site's Called Shots ledger already have money against the scenario above, and every one of them is scoreable by a stranger holding next April's stat page.
Alexander Wennberg finishes 2026-27 with more power-play points than Misa, at minus 185. Misa finishes under 60 points. Cagnoni plays fewer than 42 regular-season games. Orlov takes more power-play time than Cagnoni in the opener on October 1.
All four are deployment claims, and every number above says the deployment is crowded rather than open. The Sharks have seven defensemen for six chairs and a first power-play point who scored 18 power-play points last season and has not been beaten for the job by anybody who has played an NHL season.
A fifth row runs the other way. San Jose's power play converts 23.00 percent or better this season, which the depth chart still supports. Hitting it is worth about a point and a half.
Three arguments against me#
One, and it is the real one. All of this prices last season's roster. Mason Marchment, Trouba, Nurse, Kesselring and Ivar Stenberg were not on it. If the four skaters added this summer are worth twenty goals between them, and that is a defensible number for that group, the remaining ask drops from 66 to 46 before Askarov saves a single extra puck.
Two. The conversion is a straight line fitted to thirty-two data points, and San Jose finished about six points above the line last season. Shootouts and one-goal games do not obey a regression, and a club that keeps beating its differential needs fewer goals than this arithmetic charges it.
Three. Both special-teams figures are priced at last season's volumes, and volume is the friendliest thing about San Jose's situation. The club drew the sixth-most power plays in the league and went shorthanded the eleventh-most. A percentage is worth more when you get more chances at it, and across 84 games rather than 82 both numbers get a little bigger than the ones above.
The smallest set#
Rank these as substitutes and the answer is short.
The goaltending is not one of six things. It is the only single item on the roster large enough to move the standings by ten points, and no combination of the special-teams repairs reaches half of it. Fix that first, and San Jose is a 96-point team with a bottom-ten goals-against total.
Then the club still needs 33 more goals and there is nothing left on the list that big. That is what everything else is for, all at once, in the same season, with Celebrini playing all 84.
The call#
San Jose's penalty kill finishes the 2026-27 regular season ranked higher among the thirty-two NHL clubs than its power play. Both units finish where they finish on the league's own published team special-teams tables at season's end. Right if the club's penalty-kill rank is a smaller number than its power-play rank. Wrong if the power-play rank is smaller or the two are equal. Last season the power play ranked sixteenth and the kill twenty-sixth, so this needs a ten-place swing in the gap between them.
Price: plus 200. Resolves April 30, 2027.
Sources: the NHL's own statistics service for the final 2025-26 standings and for the team summary, power-play, penalty-kill, goaltender and San Jose skater tables behind every figure here, read September 9; the league's published 2026-27 San Jose schedule for the 84-game count and the October 1 opener against Florida; the club's contract and roster status for the seven defensemen under contract for 2026-27.