What Is Left Of Celebrini's 115 Points After The Power Play Comes Off
NHL Network's preseason panel put Macklin Celebrini third among the league's centers, behind Connor McDavid and Nathan MacKinnon. Sort that list by how fast they scored at even strength and Celebrini is second, ahead of the man ranked first. McDavid's 23-point lead on the scoring list is 21 power-play points, two shorthanded points, and nothing at all at even strength.
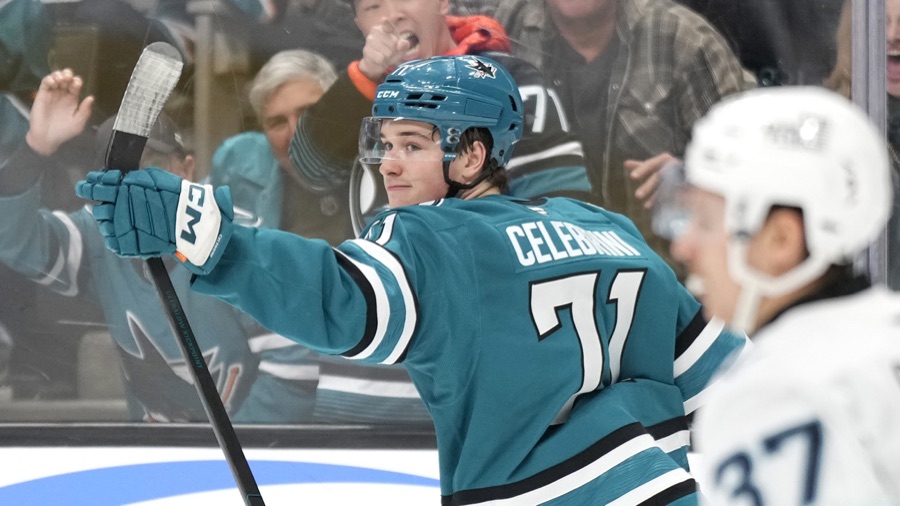
NHL Network published its twenty best centers in the league on August 24, and Macklin Celebrini came third on it, behind Connor McDavid and Nathan MacKinnon.
That order is a point total in disguise, and a point total is partly a power play. Nineteen of the twenty have a 2025-26 season on their record; Aleksander Barkov has no row that year. Sorted by the points those nineteen scored at even strength, per sixty minutes of even-strength ice time, the top of the list comes out in a different order.
Celebrini is second. The man the same panel ranked first is third.
Take the power play off the list and the order changes at the top
Even-strength points per sixty minutes of even-strength ice time, 2025-26, from Hockey Reference's season tables. The population is the nineteen centers on NHL Network's August 24 top-twenty list who played in 2025-26, with each man's rank on that list and his even-strength point total beside his name. Bars run from zero to 4.5. Teal marks the Shark. This is even strength rather than five-on-five, so it folds in four-on-four, three-on-three and empty-net shifts; read every bar as a proxy, including his.
Two eighty-twos#
Celebrini scored 82 points at even strength last season, in 82 games. McDavid scored 82 points at even strength last season, in 82 games. Not similar totals, and not close totals. The same number over the same denominator.
The rate separates them slightly, because McDavid played more of those games at even strength: 18 minutes 19 seconds a night to Celebrini's 17 minutes 27 seconds, which is 1,502 even-strength minutes against 1,431. Same output, less ice, so Celebrini's rate is higher. That is the whole of the gap between them on the chart, and it is small enough that nobody should build a monument on it.
What should be built on something is the other 23 points, the ones that put McDavid 138 to 115 on the scoring list.
Where the 23 went#
McDavid's 138 breaks into 82 at even strength, 54 on the power play and two while shorthanded. Celebrini's 115 breaks into 82 at even strength, 33 on the power play and none shorthanded. Subtract the columns one at a time and the arithmetic is uncomfortably tidy. Even strength: zero. Shorthanded: two. Power play: 21.
Every point of McDavid's lead came in a situation where somebody else was in the penalty box.
That is not an accusation, and it is not a claim that power-play points are fake. It is a claim about what the two men were standing on. Edmonton converted 30.63 percent of its power plays last season, 68 goals on 222 chances, and that was the best figure in the National Hockey League by two full points over Dallas. San Jose converted 21.18 percent, 54 goals on 255 chances, which was 16th of 32 and sat 0.07 of a point above the league average of 21.11.
A center is not the only reason his power play works. He is also not immune from it. Put a man who is genuinely excellent at this on the best unit in the sport and he will bank a number that a man who is also genuinely excellent, on a unit that is exactly ordinary, cannot bank. The point total then goes on a list, and the list gets read as a ranking of players.
MacKinnon is the control that makes the point. Colorado's power play converted 17.11 percent, 27th in the league. He scored 30 power-play points anyway and 97 at even strength, which is the highest even-strength total of the nineteen and the highest rate. Nobody needed the exercise to know he was excellent. The two men below him are where the power play did the deciding.
The three arguments against me, and the first one is real#
1. Edmonton's power play is partly McDavid. This is the argument I cannot fully answer and I am not going to pretend otherwise. A unit that converts 30.63 percent is not a piece of scenery that a player happens to be standing on; some meaningful share of that number is the man himself, and stripping his power-play points to compare him to somebody else quietly credits the difference to Edmonton's staff. The honest version of my claim is narrower than the headline: point totals mix the player and his unit, and 21 of a 23-point gap is a lot of mixing to ignore.
2. Celebrini's run of play was kinder than the team's. His on-ice shooting percentage was 14.5 and the save percentage behind him was 88.3, for a PDO of 102.9. That is the third-highest of the twenty Sharks who played 40 games or more, behind Collin Graf and Vincent Desharnais. Some of the 82 was luck, and luck does not re-sign.
3. He was started in the offensive zone more than anybody except one teammate. His offensive-zone start share was 58.7 percent, second among those same twenty Sharks behind Will Smith's 62.1. And the shot share he produced from that favorable start was 49.4 percent, meaning San Jose was still outshot with its best player on the ice. He was 3.8 percentage points better than his own teammates, which is a real number and also a number that cannot be carried across a border and set beside anybody on that chart.
What this season actually tests#
San Jose's power play is the variable. If the club moves it from 21.18 percent to something above 23, Celebrini's total climbs without a single thing changing about how he plays, and the same panels will read the climb as improvement. If the power play sits where it is, his total sits near where it is, and the same panels will read that as a plateau.
Neither reading would be about him. The number that is about him is the one on the chart, and last season it said second.
Sources: 2025-26 skater, time-on-ice and advanced tables and 2025-26 team power-play figures from Hockey-Reference.com, read August 26. The top-twenty centers list and its published order are NHL Network's, via NHL.com, August 24, which is the date that page carries.