Post-game

Edmonton got one shot when McDavid met Wennberg's line, and seven when he didn't

At five-on-five, Edmonton had one shot on goal and 0.30 expected goals in McDavid's 11:45 against Alexander Wennberg's line. In his other 7:32 it had seven shots, 0.74 expected goals and the winning goal.
DC
Dom CahillOct 11, 20264 min read
Every call on this site goes on a public ledger and gets graded. The misses stay up.
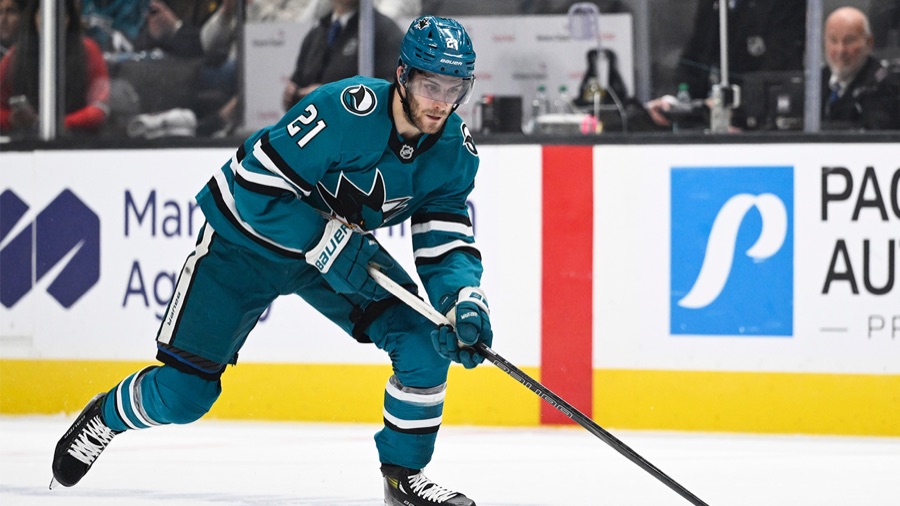
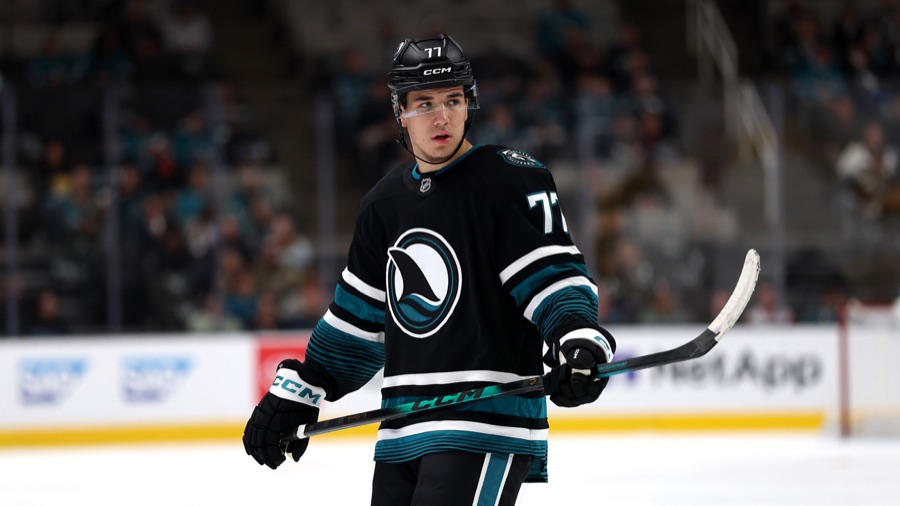
Alexander Wennberg carries the puck in San Jose's teal home sweater at SAP Center. The photograph predates this season.

Edmonton managed one five-on-five shot on goal in Connor McDavid's 11:45 against Alexander Wennberg, to San Jose's six. MoneyPuck's expected goals model put that matchup at 0.30 for Edmonton and 0.15 for San Jose, with Wennberg's minutes accounting for all the Sharks' shots on goal against McDavid.

Edmonton won 3-1 in regulation, with Macklin Celebrini back after two missed games. In McDavid's other 7:32 at five-on-five, Edmonton led seven shots to none, 16 attempts to one and 0.74 expected goals to 0.01, including Vasily Podkolzin's winner.

The assignment#

San Jose had last change at home. The Sharks' leaders in five-on-five time against McDavid were Darnell Nurse (14:29), Michael Kesselring (13:30), Ivar Stenberg (11:55), Wennberg (11:45) and Kiefer Sherwood (9:53). Leon Draisaitl accompanied McDavid for 17:05 of his 19:17 at five-on-five.

The Nurse-Kesselring pair remained involved against McDavid in both splits. Nurse shared 10:32 of Wennberg's 11:45 against McDavid at five-on-five; without Wennberg, San Jose's most-used skaters were Celebrini at 4:18, Kesselring 4:05, Nurse 3:57, Marchment 3:47 and Smith 3:44, across 7:32.

Podkolzin's five-on-five winner came against Misa, Toffoli, Marchment, Nurse and Kesselring. The largest Edmonton chance in the McDavid-without-Wennberg split was McDavid's saved shot four seconds after Celebrini's tripping penalty expired, carrying 0.31 of Edmonton's 0.74 expected goals in those 7:32.

The remaining minutes#

Without McDavid, San Jose led five-on-five expected goals 0.76 to 0.40 and attempts 25 to 12 across 32:59, while losing the goals two to one: Ekholm and Formenton against, Celebrini for. Across the full 52:16 at five-on-five, Edmonton led expected goals 1.44 to 0.92, leaving San Jose a 39.0 percent share.

San Jose is 3-2-0 with no regulation win. Its five-on-five expected-goals share through five games is 34.3 percent in MoneyPuck's team file, against 47.6 percent across 82 games last season.

The saves and the goals#

San Jose's Yaroslav Askarov stopped 17 of 20 shots in all situations. He saved all seven Edmonton power-play shots during 4:00 at five-on-four worth 1.02 expected goals; at five-on-five, he allowed three goals on 13 shots.

The Edmonton five-on-five goals carried MoneyPuck probabilities of 0.033 for Mattias Ekholm from 48 feet, 0.063 for Podkolzin from 37 feet and 0.115 for Alex Formenton from eight feet. In his Oct. 10 review, Professor Hockey wanted a save on Podkolzin's and did not blame Askarov for Formenton's. Combined, Edmonton's three five-on-five scoring shots carried 0.21 expected goals.

Celebrini played 21:59 in all situations, scoring at five-on-five from Michael Misa's assist, 28 seconds after his own tripping minor expired, on a 0.036 goal probability. His five-on-five on-ice expected goals were 0.48 for and 0.69 against across 18:47.

San Jose's lone power play lasted 2:00, including 1:48 at six-on-four with Askarov pulled, and produced 0.66 expected goals. Edmonton's Tristan Jarry saved Wennberg's deflection, carrying a 0.44 goal probability, during that power play.

Limits of the matchup#

  1. The McDavid-without-Wennberg sample is 7:32 at five-on-five, with 0.31 of Edmonton's 0.74 expected goals on a shot four seconds after a penalty expired.
  2. San Jose's six shots to one in Wennberg's 11:45 against McDavid came with Edmonton ahead in expected goals there, 0.30 to 0.15, at five-on-five.
  3. MoneyPuck's score-and-venue adjustment widens Edmonton's five-on-five expected-goals advantage to 1.60 against 0.84 across 52:16.

A second opinion#

Professor Hockey said of Stenberg-Wennberg-Sherwood against McDavid, "they did an absolutely incredible job." He also said they were not "completely dominant". He disagreed with Nurse and Kesselring's statistical showing, calling them "very good at the beginning of this game". Kesselring was on for 1.10 and Nurse for 0.99 of Edmonton's 1.44 five-on-five expected goals.

Roster#

Brett Leason cleared waivers this week, and the AHL roster feed lists him on the Barracuda's active roster. Adam Gaudette remains on the NHL roster and joined Ty Dellandrea and Nolan Allan among San Jose's three scratches for this game.

Both sets of stars#

Dom Cahill's selections:

  1. Alexander Wennberg, San Jose. In his 11:45 against McDavid at five-on-five, Edmonton had one shot on goal and San Jose had six.
  2. Connor McDavid, Edmonton. Edmonton led 1.04 to 0.16 in five-on-five expected goals across his 19:17, and he set up Podkolzin's winner.
  3. Luca Cagnoni, San Jose. San Jose led 0.38 to 0.12 in five-on-five expected goals across his 17:09, and he was on the ice for Celebrini's goal.

The NHL's official selections:

  1. Vasily Podkolzin, Edmonton.
  2. Macklin Celebrini, San Jose.
  3. Connor McDavid, Edmonton.

McDavid appears on both lists; Podkolzin and Celebrini only on the league's, Wennberg and Cagnoni only on mine. Wennberg's case starts with Edmonton's one shot on goal in 11:45 against McDavid at five-on-five.

Sources: NHL gamecenter landing, boxscore, play-by-play, right rail and shift charts; NHL standings, roster and game logs; MoneyPuck game data and team season files; AHL roster feed; San Jose Hockey Now (Sheng Peng); Professor Hockey's game review (YouTube, Oct. 10).
Filed under Sharks

More on Alexander Wennberg

His page →
Both Nashville goals followed faceoffs Wennberg lost
Post-game

Both Nashville goals followed faceoffs Wennberg lost

San Jose won the five-on-five scoring and survived in a shootout after Nashville scored twice following faceoff wins over Alexander Wennberg.

Dom CahillOct 16, 20264 min read
San Jose changed its first line on Monday, and the other three with it
Lines

San Jose changed its first line on Monday, and the other three with it

San Jose practiced on October 12 with four new forward lines: Chernyshov-Celebrini-Smith, Stenberg-Misa-Sherwood, Marchment-Wennberg-Toffoli and Ostapchuk between Graf and either Dellandrea or Gaudette, with Barclay Goodrow off the ice with an illness and questionable for Tuesday's game against Boston. The defense pairs did not change. Ivar Stenberg, 19, replaced Chernyshov on the first power-play unit; San Jose is 2 for 13 on the power play and 0 for 7 over its last three games. Warsofsky said the club is not playing in the offensive zone enough to create offense. At five-on-five San Jose has scored 7 goals and allowed 13 through five games, with 34.3 percent of MoneyPuck's expected goals, 31st of 32 clubs; last season's full-year share was 47.6 percent. Boston, 4-2-0, has allowed 7 five-on-five goals in six games.

Grant LombardOct 13, 20264 min read
Wennberg and Trouba get the other team's top line at SAP Center
Analysis

Wennberg and Trouba get the other team's top line at SAP Center

Wennberg's line drew the heavier top-line matchup at home, while Celebrini's line took more defensive-zone faceoffs; practice this week kept Allan and Trouba together and moved Stenberg's line.

Dom CahillOct 8, 20265 min read

On the record

Called Shots →
OpenAug 28, 2026

Barclay Goodrow averages less than 1:55 of shorthanded ice time per game across San Jose's first 20 games of 2026-27, down from 1:55 across all 82 games in 2025-26.

The baseline is exactly 1:55 a night across 82 games, from Hockey Reference's San Jose 2025-26 time-on-ice table. San Jose conceded 9.9 goals per sixty with him on the ice shorthanded, the highest rate of the five forwards under contract for 2026-27 who averaged at least a minute a game killing penalties (Ostapchuk 9.7, Wennberg 8.7, Dellandrea 8.4, Graf 5.4), with no shorthanded goals or assists of his own. The kill finished 76.42 percent, 26th of 32, against a league average of 78.87. This is a call about DEPLOYMENT, not about the player: the claim is that the coaching staff moves the minutes, not that Goodrow declines further. For the call: the club's own 2026-27 scorecard sets a success condition of a top-20 kill with the Goodrow and Wennberg tier reduced; DailyFaceoff's July 4 projected lines have him as an extra rather than in the twelve; and Professor Hockey said on August 12 it would be coaching malpractice if he played all 84 games. Against it: he dressed all 82 last season, he is an alternate captain in a contract year, Ryan Warsofsky is himself in the final year of his deal and veterans are what coaches reach for in October, and an injury to Graf or Wennberg hands those minutes straight back to him.

Latest on the Sharks

The whole beat →
San Jose has held its own for three games. One line has not.
Weekly review

San Jose has held its own for three games. One line has not.

San Jose's improved five-on-five play has left the Stenberg-Misa-Sherwood combination behind as the road trip reaches its first back-to-back.

Dom CahillOct 18, 20265 min read
San Jose has led by two in the third four times and won none in regulation
Post-game

San Jose has led by two in the third four times and won none in regulation

San Jose's repeated third-period trouble now accompanies better five-on-five play, with the Celebrini line driving the improvement at Detroit.

Dom CahillOct 18, 20264 min read
Trouba is a mile an hour slower than a year ago. His shot is not.
Player deep dive

Trouba is a mile an hour slower than a year ago. His shot is not.

Jacob Trouba has not gone over 20 mph in eight games for San Jose, after doing it at least twice in his first eight games for Anaheim last season. His shot has not slowed, and no Sharks defenseman plays more.

Dom CahillOct 18, 20265 min read

Earlier on the Sharks

Sam Dickinson Was Better Against The Best Forwards He Faced Than Against The Worst Ones
Season preview

Sam Dickinson Was Better Against The Best Forwards He Faced Than Against The Worst Ones

PuckIQ's WoodMoney model splits even-strength ice time by the quality of the opposition. Sam Dickinson spent 23.2 percent of his against elite forwards last season, against 39.0 percent for Mario Ferraro and 35.3 for Dmitry Orlov, and San Jose outscored the opponent 15 to 11 in those 220.7 minutes. In the 385.1 minutes he played against the softest tier, San Jose was outscored 19 to 12. He is signed at $953,750 on a blue line carrying $17,500,000 of Darnell Nurse and Jacob Trouba.

Dom CahillSep 13, 20265 min read
SHARKS CAP DESK$75M-to-$80M against a caparound $133M, about 58percentgrabsomepine.comsharks
Sharks cap desk

The five-year cap math: can they keep everyone? (The Florida-or-Chicago question, answered)

The five-year cap math: can they actually keep everyone?

Grab Some PineJun 11, 20265 min read
The Toffoli–Misa–Graf Line: Sixty-Seven Minutes, Sixty Percent, Zero Goals Against
Analysis

The Toffoli–Misa–Graf Line: Sixty-Seven Minutes, Sixty Percent, Zero Goals Against

The 2025-26 Sharks ran out a dozen different forward combinations around Michael Misa. Nine games and sixty-seven minutes of one specific configuration produced the best per-minute

Grab Some PineMay 14, 202612 min read