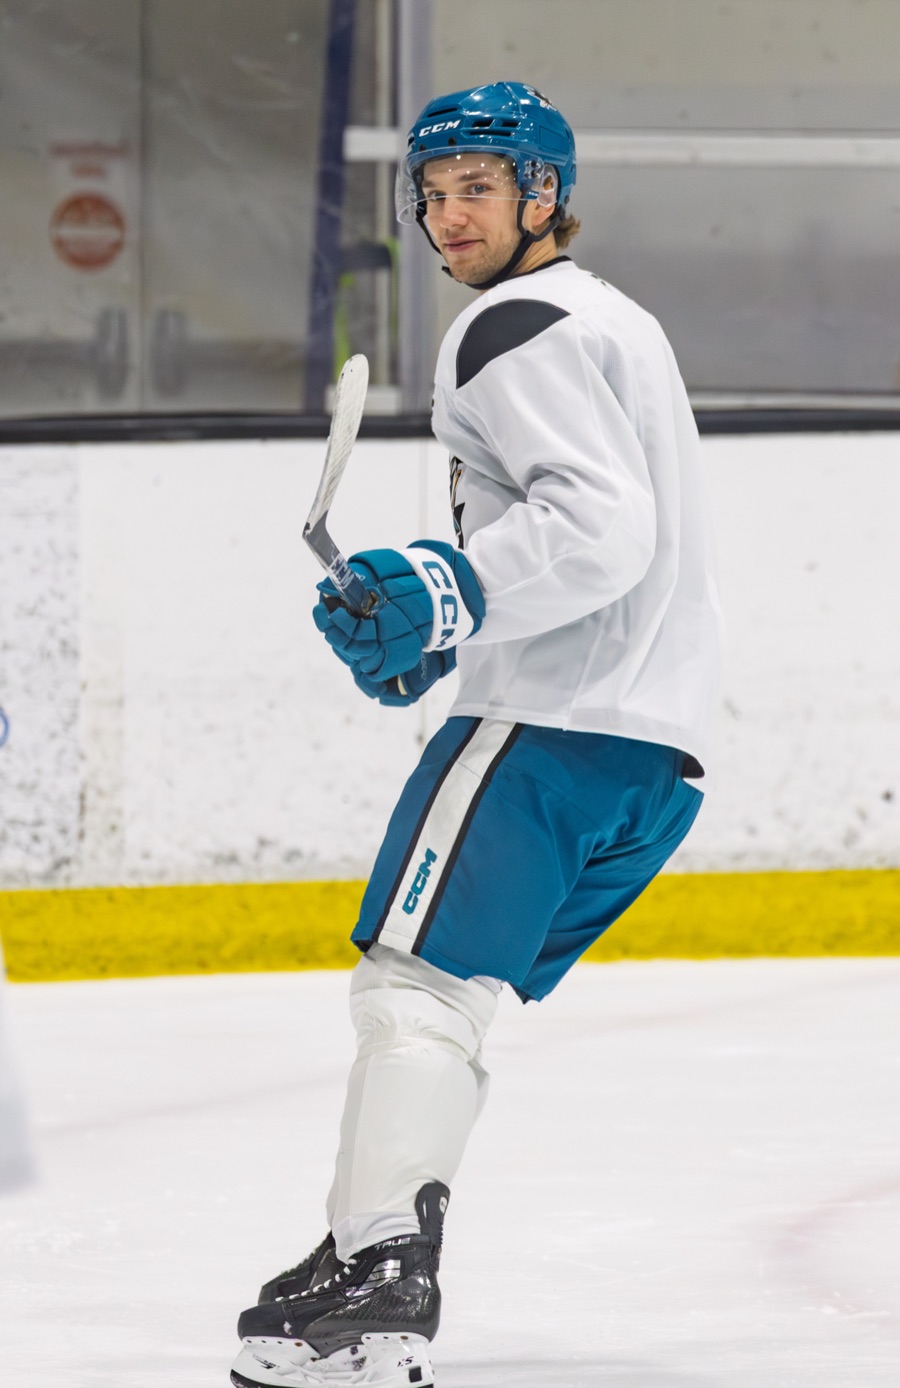
Celebrini came back from two missed games with last season's legs
Celebrini's tracking rates match or beat 2025-26 after his lower-body injury. Five of his six points came away from five-on-five, where San Jose's chance share is 41.3 percent with him on the ice and 30.7 without.
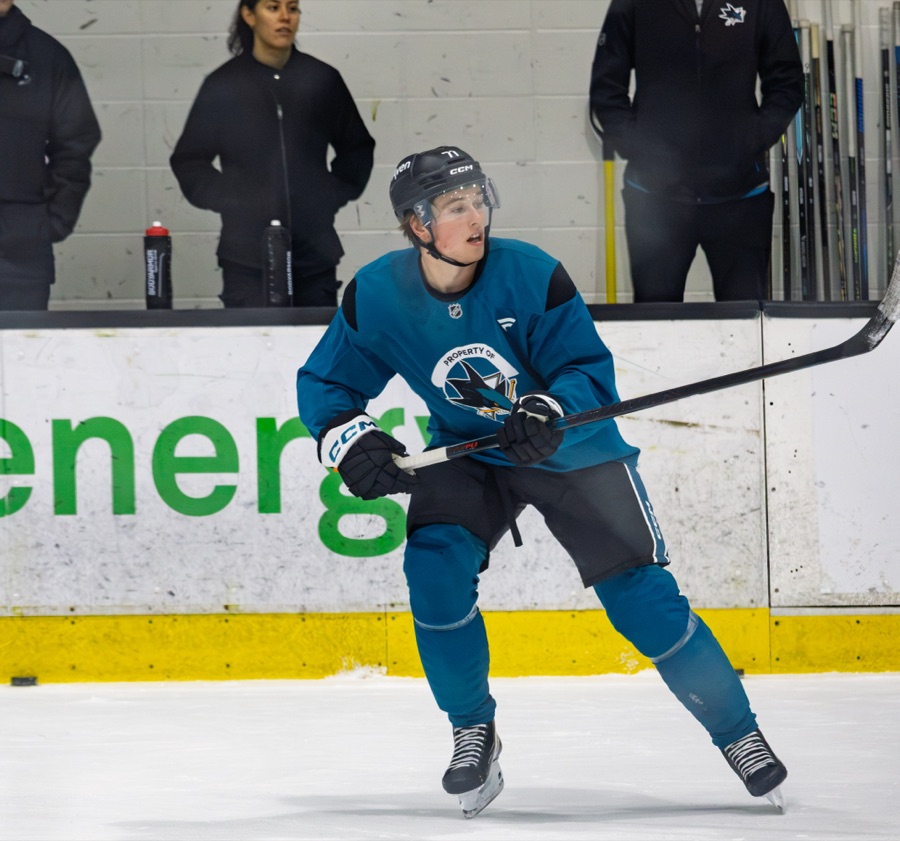
Macklin Celebrini's first game back took 21:59 of ice time, 3.80 miles of skating and one five-on-five goal against Edmonton on Oct. 10. A lower-body injury had cost him the games at Dallas and St. Louis, so his season is three games long.
The tracking rates match or beat last season's; the change is in the points and the work surrounding them. A larger share of his faceoffs comes in his own end while San Jose's chances have deteriorated around him, and five of his six points have come away from five-on-five.
The legs#
NHL Edge's skating-distance table has Celebrini at 10.55 miles per 60 minutes in all situations, against 10.08 across last season's 82 games. Those rates sit in the 97.2nd and 88.5th percentiles, with league averages of 9.66 and 9.60. At even strength, the comparison is 10.52 against 10.19 miles per 60 minutes, the 93.0th and 85.4th percentiles, against league averages of 9.93 and 9.83.
Three games of percentiles are a small sample, not a new level of player. The per-game counts agree with the rates. Over the same three-game and 82-game windows, his all-situations bursts of 20 to 22 mph run at 3.0 per game against 2.2; bursts of 18 to 20 mph run at 13.7 against 10.6 per game. Average shot speed, also all situations, is 62.5 mph against 62.26. Restricting Edge's dated fastest-burst list to each season's opening three games gives top skating speeds of 21.94 mph this season and 21.82 last season.
His hardest shot has no matching three-game baseline from last season, so it stays out of the comparison.
The return fits his earlier skating-distance rates, too. At even strength, Oct. 1 brought 10.42 miles per 60 minutes in 15:32, and Oct. 3 brought 10.61 in 18:36; back against Edmonton, he covered 10.53 miles per 60 minutes in 20:07.
| Measure and situation | 2026-27 (3 games) | 2025-26 (82 games) | Comparable? |
|---|---|---|---|
| Ice time per game, all situations | 22:13 | 21:19 | Yes |
| Distance per 60 minutes, all situations | 10.55 miles | 10.08 miles | Yes |
| Distance per 60 minutes, even strength | 10.52 miles | 10.19 miles | Yes |
| Bursts of 20 to 22 mph per game, all situations | 3.0 | 2.2 | Yes |
| Top skating speed through three games, all situations | 21.94 mph | 21.82 mph (first 3 games) | Yes, three games |
| Average shot speed, all situations | 62.5 mph | 62.26 mph | Yes |
| Hardest shot, all situations | 85.83 mph | Not available for 3 games | No |
| Five-on-five expected-goal share (minutes) | 41.3% (52.0) | 49.6% (1,346.6) | Yes, three games |
| Defensive-zone share of faceoffs, all situations | 41.3% (19 of 46) | 27.0% (347 of 1,285) | Yes, three games |
Where the points came from#
The NHL's game summaries put his assists on Will Smith's shorthanded and power-play goals and Luca Cagnoni's three-on-three winner on Oct. 1, then Tyler Toffoli's power-play goal and Igor Chernyshov's three-on-three winner on Oct. 3. The Edmonton goal, assisted by Michael Misa, supplied his five-on-five point. That makes two power-play points, one shorthanded and two in overtime, with five-on-five accounting for one of six.
Last season's opening three games produced three points, all assists. Across the full season, five-on-five supplied 62 of his 115 points in 82 games.
The five-on-five gap#
MoneyPuck's season and game files give San Jose 41.3 percent of expected goals with Celebrini on in 52.0 five-on-five minutes, against 30.7 percent without him in the same games' 101.8 minutes. The Sharks managed 34.0 percent in 98.8 minutes during his two absences and 34.3 percent across all five games' 252.6 minutes. Last season, his on-ice share was 49.6 percent in 1,346.6 minutes and the team's was 47.6 percent across 82 games. Last season's card put his on-minus-off gap at plus-3.11 percentage points. Through three games it is plus-10.6.
San Jose is losing the chance count during his shifts and losing it by more when he sits.
There is less offense in his own minutes as well. Per 60 five-on-five minutes, expected goals for fell from 2.58 to 1.56 and against from 2.63 to 2.22, comparing last season's 1,346.6 minutes with this season's 52.0. His own shot attempts fell from 14.2 to 10.4 per 60 five-on-five minutes over those same windows.
The extra work#
His defensive-zone faceoffs account for 19 of 46 draws in all situations, 41.3 percent, against last season's 347 of 1,285, or 27.0 percent. MoneyPuck's five-on-five offensive share of offensive-plus-defensive faceoff starts fell to 60.0 percent, nine of 15, from 67.7 percent, 241 of 356. That describes faceoff starts, leaving out shifts begun on the fly.
His shorthanded time totals 2:11 across three games, with 2:06 on Oct. 1, when he supplied the primary assist on Smith's shorthanded goal; last season brought 15:16 across 82 games. The open Sept. 17 call under this byline remains 50.0 percent or better on faceoffs for 2026-27, after 48.6 percent last season. He currently stands at 45.7 percent, winning 21 of 46 draws.
The arguments against me#
- More defensive work may be one night's penalty trouble. Of his 2:11 shorthanded across three games, 2:06 came against Florida.
- The scoring distribution need not persist. Last season's 62 five-on-five points in 82 games, 0.76 per game, leave room for an ordinary stretch of one in three games.
- The wider on-off gap can flatter him through the team's deterioration. His 41.3 percent five-on-five share in 52.0 minutes trails last season's 49.6 percent in 1,346.6 minutes.
The card and the rating#
Last season's card placed him in the first-line tier, with a Pine Net Rating of 25.6 per 82 games, the 97th percentile of 469 forwards, and defense in the 42nd percentile. Rated against last season's replacement level, he ranks second among San Jose skaters behind Kiefer Sherwood, with a season total of plus-1.19 through three games.
Sources: NHL Edge (2025-26 and 2026-27); the NHL's game logs, stats feed and game summaries; NHL.com (Oct. 10, 2026, injury designation); MoneyPuck's season and game-by-game files (2025-26 and 2026-27).