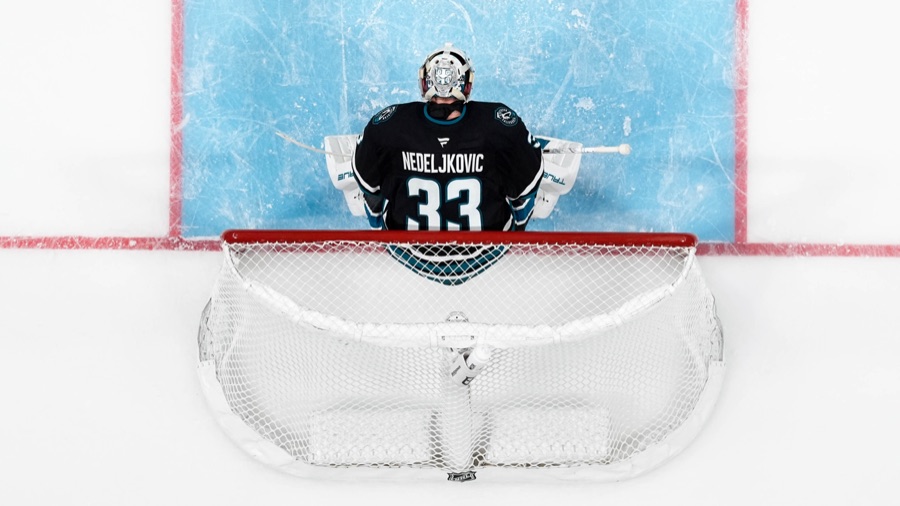
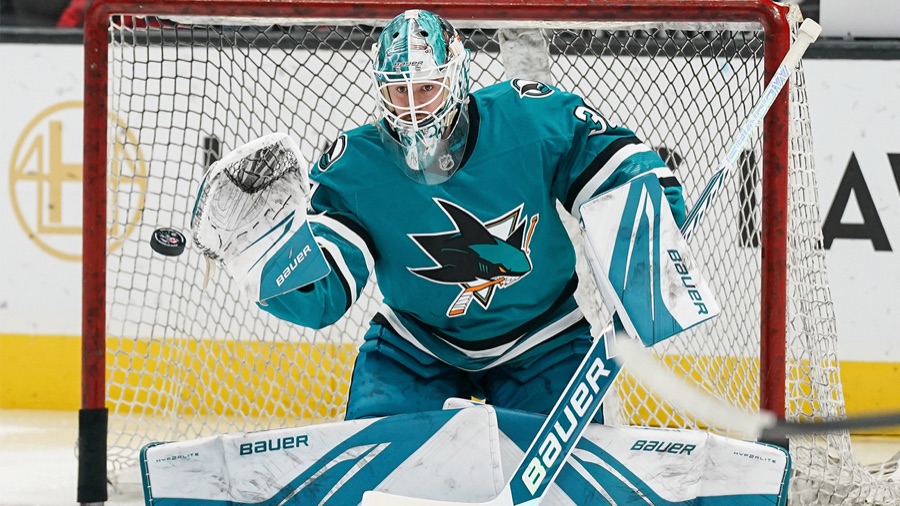
The Sharks' opponents miss the net more than anyone's. Last season, the least
Expected goals prices every shot before anyone knows whether it hits the net. How a goaltender measure handles the ones that miss decides whether Yaroslav Askarov has saved six goals this season or allowed six too many.
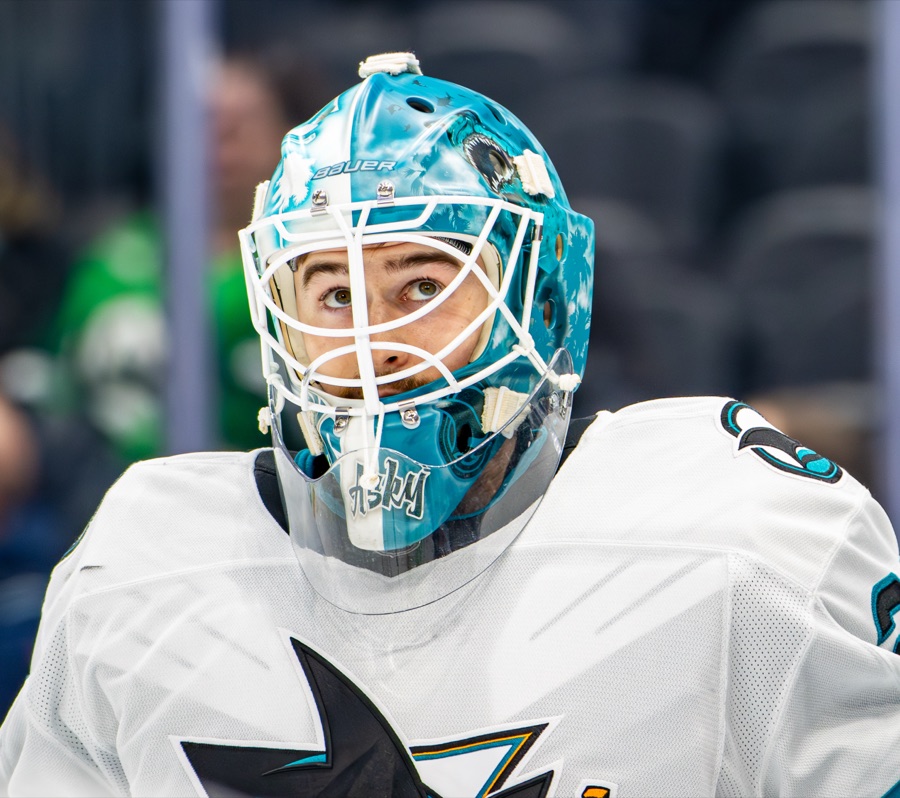
There is a way to measure goaltending under which 44 of the NHL's 50 busiest goalies have allowed more goals than expected this season.
It is not a slump. It is arithmetic, and it explains why two ways of crediting San Jose's goaltenders, built from the same shots, disagree about both of them.
Where expected goals puts the misses#
An expected-goals model looks at an unblocked shot attempt (where it came from, the angle, what happened just before it) and prices the chance it goes in. The public model here is MoneyPuck's. It prices the attempt at the moment it leaves the stick, before anyone knows whether it will hit the net. A wrist shot from the slot that sails wide still carries its full price.
Across the league this season, through Wednesday's games, unblocked attempts against goaltenders carried 1,217 expected goals. Goalies allowed 1,190. That is close, which is the point of the model.
About 30 percent of those expected goals, though, sat on shots that missed the net. Nobody scores on a miss. So when you count only the shots that reached the goaltender, the league as a whole faced 849 expected goals and allowed 1,190. Goals ran at 1.40 times the expected total on shots on goal. Last season, over a full schedule, the ratio was 1.43.
Any goalie measure built on shots on goal alone, with no adjustment, starts every goaltender in the hole. That is why 44 of 50 are below it.
Two measures, opposite answers#
Here is what that does to San Jose's two goaltenders. Every expected-goals figure in the table is model output summed shot by shot; the counts are counted.
| Through Oct. 28 | Askarov | Nedeljkovic |
|---|---|---|
| Shots on goal faced | 246 | 155 |
| Save percentage | .898 | .903 |
| Goals allowed | 25 | 15 |
| Expected goals, all unblocked attempts (model) | 31.0 | 19.6 |
| Expected goals, shots on goal only (model) | 19.3 | 12.9 |
| Saved above expected, counting misses | +6.0 | +4.6 |
| Saved above expected, shots on goal only | -5.7 | -2.1 |
| Saved above expected, shots on goal times 1.40 | +2.0 | +3.1 |
The first measure is the one MoneyPuck publishes, and it says both men have been well above expected. The second says both have been below. The third rescales the second by the league's own 1.40, so that an average goalie comes out at zero, and it lands in between.
All three are built from the same shots. What separates them is who gets the credit when a shot misses the net.
San Jose went from last to first#
The misses are not spread evenly. Against San Jose this season, opponents have missed the net on 250 of 649 unblocked attempts.
The Sharks went from the NHL's lowest opponent miss rate last season to its highest this season
Share of opponents' unblocked shot attempts that missed the net, regular season, empty-net and shootout attempts excluded. 2026-27 runs through Oct. 28. The goaltenders were Askarov and Nedeljkovic in both seasons. A full bar is 40 percent.
The two San Jose bars are the story. Same two goaltenders, opposite ends of the league, a year apart. Askarov's own line moved with the team's: opponents missed on 32.5 percent of their attempts against him last season, 72nd of the 80 goalies who faced at least 100 shots on goal. This season it is 38.9 percent, second of 50.
Weighted by expected goals, the gap is wider. About 38 percent of the expected goals against Askarov this season sat on misses, the highest share of any of the 50. The league share is 30 percent. Had shooters missed against him at the league rate, with the shots that reached him held fixed, those misses would be worth about 8.4 expected goals instead of 11.7. Take the extra 3.3 out of his +6.0 and he is at about +2.7, which sits close to the rescaled +2.0. Nedeljkovic's excess is smaller, about 1.1, and he lands near +3.5.
Both corrections land in the same place. Between three and four of Askarov's six goals belong to the shooters who missed.
Does a goaltender make shooters miss?#
This is the question that decides which measure to trust, and last season answers it about as clearly as one season can.
I split 2025-26 into odd- and even-numbered games and took every goalie who faced at least 600 unblocked attempts in each half, n = 38. Then I asked whether a goalie's opponent miss rate in one half predicted it in the other. By count, the correlation was 0.15. Weighted by expected goals, it was 0.02. For a baseline, save percentage itself, a famously noisy number, correlated at 0.22 between the same halves, on a median of 642 shots on goal per half.
A correlation of 0.02 is no relationship at all. The misses a goalie saw in one set of games told you almost nothing about the misses he would see in the other. Teams did a little better across all 32, at 0.22 by count and 0.24 weighted, which is weak and still more than the goalies managed.
The numbers say the miss credit belongs mostly to chance and a little to the team in front of the goalie. They do not rule out a real goalie effect too small for 38 goaltenders and one season to see, and some of the miss rate is the shooters' own skill. What they do rule out is a large, steady one. A goalie measure that hands Askarov full credit for 38 percent misses is crediting him for something nobody has shown he does.
What it means from here#
Neither of San Jose's goaltenders has been a six-goal goalie or a below-expected goalie. On the shots that reached them, scaled to the league, both have been modestly better than average: Askarov 17th of 50 at about +2, Nedeljkovic 12th at about +3, on 91 fewer shots. Per shot on goal, Nedeljkovic has been the better of the two this season. That is a small gap on a small sample, and it is the opposite of what the published figure suggests.
The miss rate is the number to watch, because it is the one most likely to move. If it drifts back toward the league's 35 percent, more of the shots that would have missed will reach the net, and Askarov's save percentage has to carry them.
He is at .898 on 246 shots. San Jose plays 30 more games through Dec. 29. If he starts half of them and faces his current 31 shots a start, that is about 465 more shots (my estimate), and he needs to stop a little over 90 percent of them to finish the calendar year at .900. Last season he finished at .884 on 1,341 shots. The rescaled measure says he has been somewhat better than that this year, and the split-half numbers say not to bank much of it.
The call: Askarov's NHL save percentage is below .900 after San Jose's games of Dec. 29. Check it on New Year's Day.
Data: MoneyPuck's public shot-by-shot files for 2025-26 and 2026-27 (2026-27 through the 202 games of Oct. 28), regular season, empty-net and shootout attempts excluded. Expected goals is MoneyPuck model output; goals, shots and misses are counted. The 50: goaltenders who have faced 100 or more shots on goal this season in the shot file. The 1.40: league goals divided by league expected goals on shots that reached the net, 1,190 on 849. Multiplying a goalie's on-goal expected goals by it sets the league average to zero. Split-half test: 2025-26 odd against even game numbers; goalies with 600 or more unblocked attempts against in each half (n = 38), teams with 1,000 or more (n = 32). Pearson correlation. Counts: the shot file has Askarov at 243 shots on goal and Nedeljkovic at 156; the table uses the NHL's 246 and 155. MoneyPuck's own goalie table, which counts slightly differently, puts Askarov at about +5.2 on the first measure. Weakness: one league multiplier treats every shot on goal alike, when a shot from the slot that reaches the net is likelier to score than a point shot that does. One season of split halves cannot see a small effect.
Sources: MoneyPuck shot data, 2025-26 and 2026-27, and 2026-27 goalie season summary; NHL.com goalie statistics for 2026-27 and player career pages for Askarov and Nedeljkovic; NHL.com San Jose schedule.