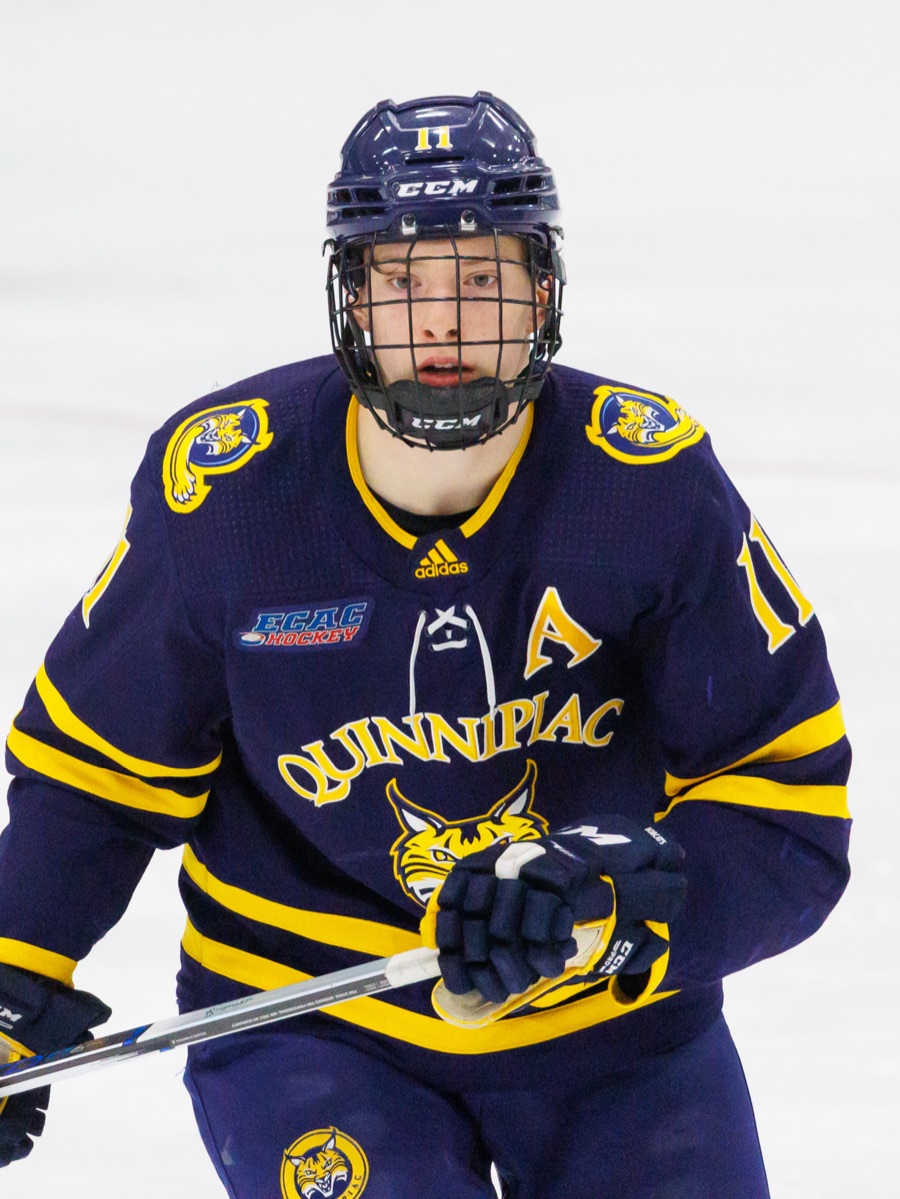
San Jose scored four in Boston. None came at five-on-five.
Boston won five-on-five 4-0 on 3.25 expected goals to San Jose's 1.07. Through 12 games, the Sharks have been outscored 27-16 at five-on-five.
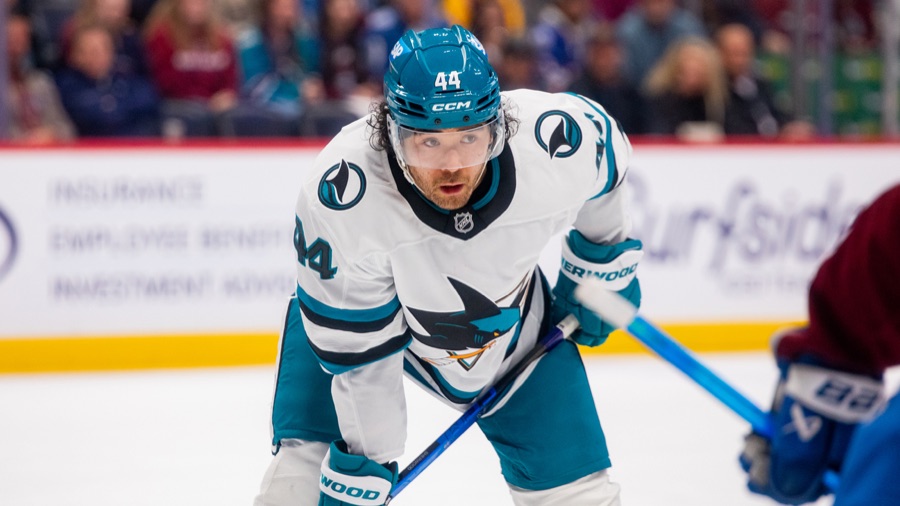
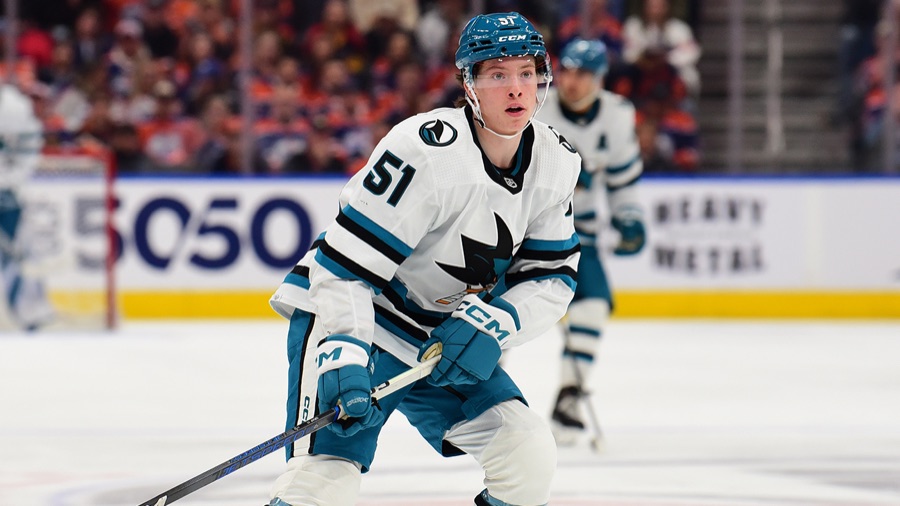
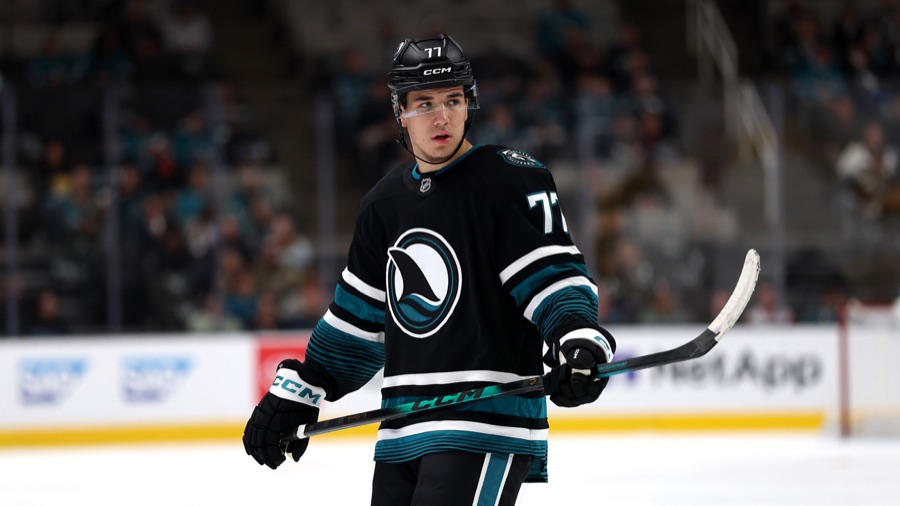
All four San Jose goals in Saturday's 6-4 loss at Boston came with somebody in a penalty box. Michael Misa and Dmitry Orlov scored on the power play, Kiefer Sherwood shorthanded, Will Smith at four-on-four. Boston won five-on-five 4-0, with 3.25 expected goals to San Jose's 1.07 in MoneyPuck's game data. The Sharks stayed within reach on the scoreboard while collecting 24.8 percent of the game's five-on-five expected goals.
Four goals, four boxes#
Misa's power-play backhand came from 7 feet, with a goal probability of 0.056 in MoneyPuck's per-event file. Sherwood's unassisted shorthanded snap shot came from 19 feet with a probability of 0.31, tying the game while Orlov served a tripping minor.
Orlov's power-play slap shot from 54 feet went off a Boston player, with a goal probability of 0.054. Smith's four-on-four snap shot from 23 feet carried a probability of 0.134 and brought San Jose within a goal in the third.
The goal probabilities on San Jose's four scoring shots, across those four manpower situations, added to 0.56.
Tied, and not close#
Boston's advantage accumulated while the result was still open. In about 29 minutes of tied five-on-five play, Boston generated 3.20 expected goals on 40 unblocked attempts, including 25 shots on goal; San Jose had 0.81 on 12, with 8 on goal. Casey Mittelstadt, Marat Khusnutdinov and James Hagens scored while tied, accounting for three of Boston's four five-on-five goals.
Darnell Nurse and Michael Kesselring spent 8.7 minutes together at five-on-five, about a fifth of San Jose's time at that strength. MoneyPuck's player-game file gives them 0.09 expected goals for and 1.52 against, almost half Boston's five-on-five total. They were on for the goals by Mittelstadt, Khusnutdinov and David Pastrnak, three of Boston's four at that strength.
Sam Dickinson and Jacob Trouba had a less expensive evening together, with 0.18 five-on-five expected goals for and 0.32 against in 9.1 minutes, and no goals either way. Adjusting for score and venue still left San Jose with 26.4 percent of this game's five-on-five expected goals.
Two minutes and forty-eight seconds#
MoneyPuck's live win-probability model had San Jose above its pregame chances after Sherwood's equalizer. The lead and Pastrnak's penalty then raised the Sharks to their game-high 82.5 percent chance of winning.
| Moment | Score (San Jose first) | San Jose's win probability |
|---|---|---|
| Before the game | 0-0 | 33.3% |
| After Sherwood's goal | 2-2 | 43.8% |
| After Orlov's goal | 3-2 | 78.0% |
| After Pastrnak's penalty | 3-2 | 82.5% |
| After Pastrnak's goal | 3-3 | 48.1% |
| After Hagens's goal | 3-4 | 17.7% |
| After Fraser Minten's goal | 3-5 | 1.6% |
The power play during Pastrnak's minor produced a shot on goal by Macklin Celebrini from 9 feet and a blocked attempt. Pastrnak's penalty expired at 8:19 of the third, and his next shift began at 8:19. He scored at 8:27, a five-on-five snap shot from 40 feet that deflected off a San Jose player, carrying a goal probability of 0.050.
Hagens scored 40 seconds later, and Fraser Minten's power-play goal extended Boston's lead. From Pastrnak's penalty to Hagens's goal, San Jose's win probability fell from 82.5 to 17.7 percent in 2:48 of game time. San Jose's entire lead lasted 4:24 of the game.
Twelve games#
Saturday's 24.8 percent was San Jose's second-lowest five-on-five expected-goals share in twelve games, and only the 24.0 at Dallas on Oct. 5 was lower. The Oct. 13 meeting with Boston produced a 50.4 percent share.
Through twelve games, MoneyPuck's game-by-game totals have San Jose at 16 goals for and 27 against at five-on-five. Every other situation combined, empty nets included, favors the Sharks 20-15, leaving the overall count at 36-42. Their five-on-five expected goals stand at 21.38 for and 29.93 against, a 41.7 percent share through twelve games.
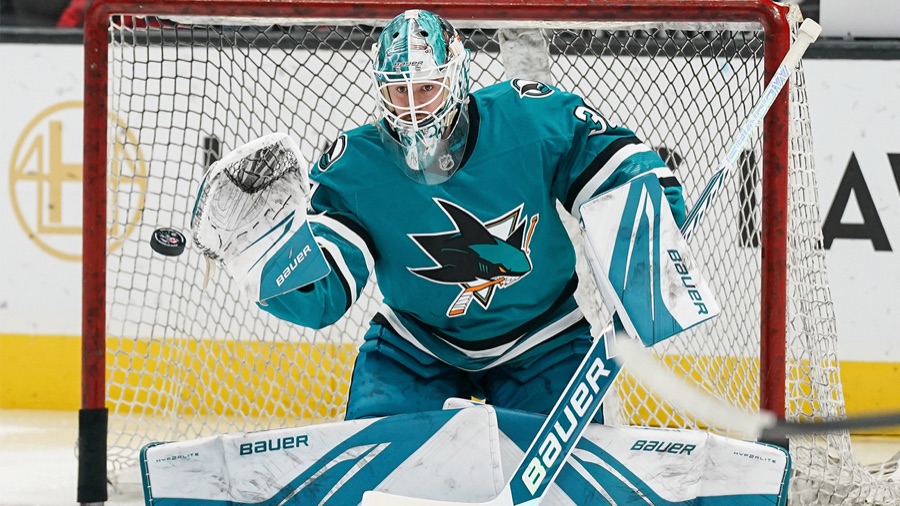
Alex Nedeljkovic faced 34 shots on goal on Saturday carrying 3.39 expected goals across all situations, empty-net shots aside, and allowed 5. Jeremy Swayman faced 27 carrying 2.07 and allowed 4.
San Jose is 6-5-1 in the NHL standings. The NHL team summary puts its power play at 26.8 percent, 11 goals on 41 opportunities, and its penalty kill at 80.5 percent, 33 successful kills in 41 opportunities.
The arguments against me#
- A power play converting 26.8 percent of 41 opportunities gives San Jose a skill to rely on. Goals with somebody in the box count in full, and the Sharks have scored 11 on those chances.
- San Jose's five-on-five finishing has lagged its chances, with 16 goals on 21.38 expected through twelve games. Some of the minus-11 goal difference may reflect recoverable finishing, with 27 allowed on 29.93 five-on-five expected goals against.
- Boston is 9-2-1, and Saturday is a single game against that opponent. In the earlier meeting, San Jose earned 50.4 percent of the five-on-five expected goals.
Three stars, twice#
Dom Cahill's stars:
- Casey Mittelstadt (BOS): His 1.19 individual five-on-five expected goals exceeded San Jose's team total of 1.07; he scored the opener and assisted on Minten's goal.
- James Hagens (BOS): He scored the winner 40 seconds after Pastrnak's equalizer and assisted on the opener; Boston had 1.69 five-on-five expected goals to San Jose's 0.60 with him on the ice.
- Kiefer Sherwood (SJS): His unassisted shorthanded goal tied it 2-2, with San Jose's live win probability rising from 24.4 percent after Orlov's penalty to 43.8 percent after the goal.
The NHL's stars:
- Fraser Minten (BOS)
- Casey Mittelstadt (BOS)
- Will Smith (SJS)
Mittelstadt is second for the league and first here; the NHL puts Minten first, with a power-play goal that made it 5-3 and an assist, and Smith third where Hagens and Sherwood fill this list. Smith led San Jose with 0.45 individual five-on-five expected goals, while his line with Celebrini and Collin Graf had 0.55 expected goals for and 1.72 against in 10.5 five-on-five minutes together.
Sources: NHL gamecenter landing, boxscore, play-by-play and right rail; NHL shift charts; NHL standings; NHL stats API team summary; MoneyPuck game data, player-game file and San Jose game-by-game file.