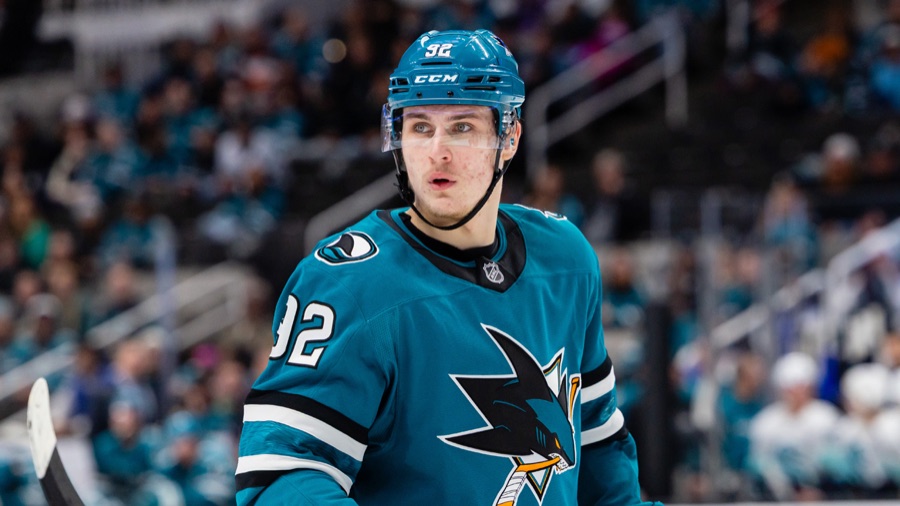
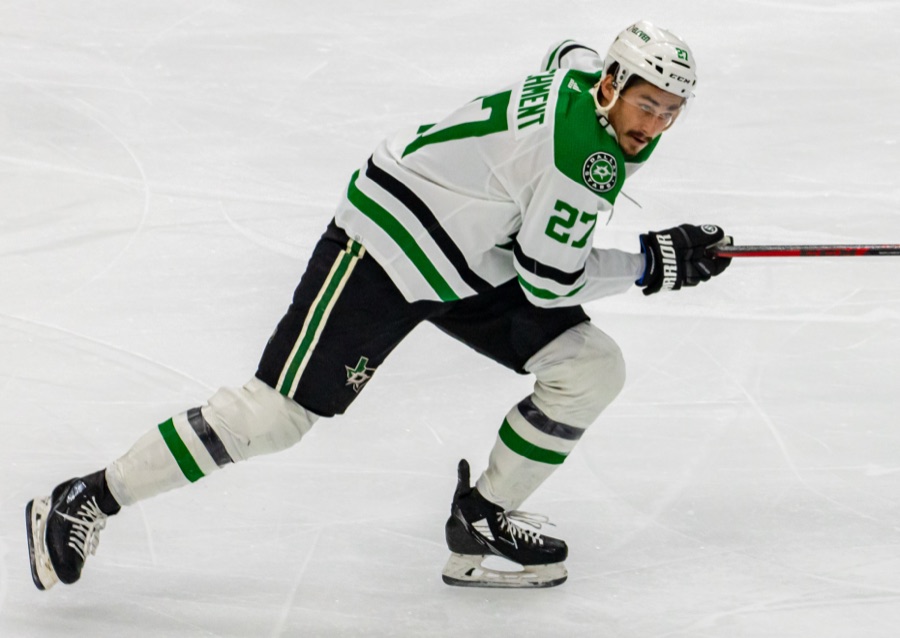
Marchment has a third of San Jose's power play after two-thirds of Columbus's
Mason Marchment has played 15.9 of San Jose's 50.3 five-on-four minutes through nine games, against 101.5 of Columbus's 150.2 in his 39 games there last season. He covers more ice a minute than he did a year ago, 9.99 miles per 60 against 9.53, and more of his shifts start in his own end.
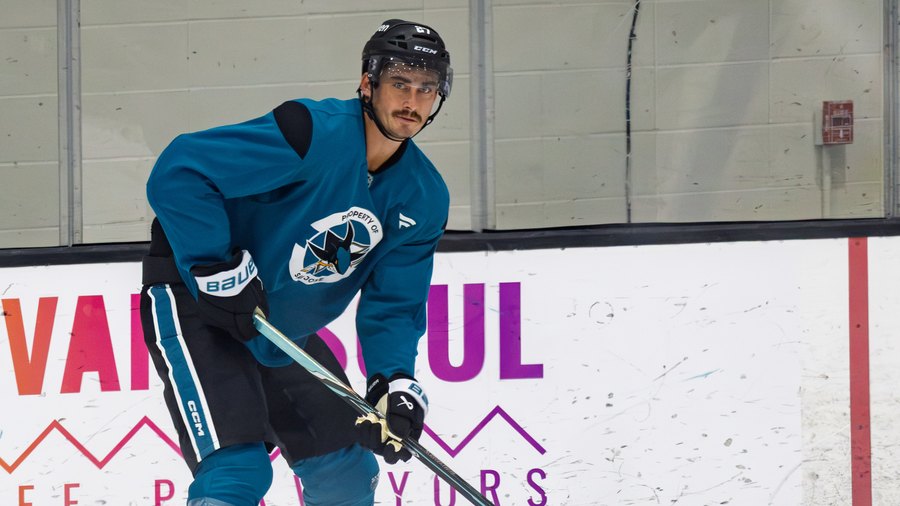
Mason Marchment's share of his club's five-on-four minutes is down to 31.7 percent in San Jose from 67.5 percent in Columbus. By MoneyPuck's count that is 15.9 of San Jose's 50.3 minutes through nine games, against 101.5 of Columbus's 150.2 in his 39 games there last season.
This season is nine games in San Jose. Last season was 68 games, 29 in Seattle and 39 in Columbus, so its single-season totals lean toward Columbus. A maximum is compared only across the same nine-game window in each season. Everything else is a rate, an average, a share or a percentile inside that season's own league pool.
The power play#
Seattle, where last season began, gave him 36.1 percent of its five-on-four minutes across his 29 games. His five-on-four time per game in San Jose, 1:46, is his Seattle figure to the second, and Columbus gave him 2:36 across 39 games. Counting every power-play situation, he plays 1:56 a game, fifth among the 13 San Jose forwards who have dressed, behind Macklin Celebrini, Alexander Wennberg, Will Smith and Ivar Stenberg.
Chances here means MoneyPuck expected goals. San Jose generates 3.58 per 60 at five-on-four with Marchment, over 15.9 minutes, against 7.05 across San Jose's 50.3 through nine games. He has no power-play points in nine games and four shots on goal in 15.9 five-on-four minutes.
The starts#
Even-strength time per game has fallen from 15:03 across 68 games to 14:01 through nine. His five-on-five shifts that began with a faceoff have started 24 times in the offensive zone, 15 in the defensive zone and 20 in the neutral zone. Offensive starts as a share of offensive plus defensive is 61.5 percent, against 68.3 last season, 200 of 293. Columbus gave him 76.9 percent across 39 games and Seattle 55.8 across 29. NHL Edge's count of all faceoff starts in every manpower situation points the same way, with his defensive-zone share up from 25.2 percent across 68 games to 29.8 through nine.
The Sept. 5 piece on this site set three October readings for this question. Over 15 even-strength minutes a night and over two on the power play meant the Columbus job; 13:30 and 1:30 meant a second-line winger. Through nine games he sits between the two on both, at 14:01 and 1:56. My open call from that piece, that his even-strength offensive-zone start share finishes the season under 60 percent, resolves Apr. 30, 2027, and it stands. Through nine games he is above that line at 61.5 percent, 24 of 39 starts.
| Measure | 2026-27, 9 games | 2025-26, 68 games | Kind |
|---|---|---|---|
| Club five-on-four share | 31.7% | 67.5% Columbus, 36.1% Seattle | share |
| Five-on-four minutes per game | 1:46 | 2:36 Columbus, 1:46 Seattle | per-game rate |
| Even-strength time per game | 14:01 | 15:03 | per-game rate |
| Five-on-five offensive faceoff-start share | 61.5% | 68.3% | share |
| Top skating speed through his first nine games | 20.80 mph | 21.42 mph (first nine games) | maximum, same nine games |
| Bursts over 20 mph per 60, all situations | 2.91 | 1.32 | rate |
| Distance per 60, all situations | 9.99 miles | 9.53 miles | rate |
| Distance per 60, even strength | 10.11 miles | 9.79 miles | rate |
| Average shot speed, all situations | 65.46 mph | 56.17 mph | average |
| Shots on goal per game, all situations | 2.11 | 1.75 | per-game rate |
| Points per game, all situations | 0.33 | 0.66 | per-game rate |
| Five-on-five on-ice chance share | 45.1% | 54.0% | share |
| Five-on-five share, on minus off | +1.8 points | +5.0 points | share |
The legs#
The skating rates have gone up. He is 31, and his distance per 60 across all situations has risen from 9.53 miles across 68 games to 9.99 through nine, from the 39th percentile of last season's league pool to the 80th of this one. At even strength it has risen from 9.79 to 10.11, the 46th percentile and then the 74th. He covers slightly less ice per game, 2.67 miles against 2.76, because he plays fewer minutes.
His bursts over 20 mph across all situations number seven through nine games against 26 across 68. That is 2.91 per 60 minutes of ice against 1.32, and at last season's rate his minutes so far would hold about 3.2. The 18-to-20 band is flat at 3.33 a game against 3.29. The one skating measure that is lower is the maximum, 20.80 mph at Detroit on Oct. 17 against 21.42 at Philadelphia on Oct. 20, 2025, down 0.62 mph through nine games apiece.
The shot#
His average shot speed across all situations has risen from 56.17 mph across 68 games to 65.46 through nine, the 78th percentile and then the 93rd. Attempts of 70 to 80 mph have gone from 0.87 a game to 1.44, and attempts of 80 to 90 from 0.31 to 0.44. Shots on goal are up from 1.75 a game to 2.11 while attempts are flat, 3.85 against 3.78. Edge puts 5 of his 19 shots on goal in the slot against 40 of 119 last season, and 3 of 19 from long range against 12 of 119.
His three goals, two from the low slot and one from the right point, are 15.8 percent on 19 shots against a career 13.2 on 744. His hardest shot this season, 85.58 mph on Oct. 1 against Florida, is harder than anything he shot in his first nine games last season.
Five-on-five#
With Marchment on the ice at five-on-five, San Jose holds 45.1 percent of the chances over 120.7 minutes. With him off, in the same nine games, it holds 43.3, so he is 1.8 points above his own team, which sits at 43.8 for the season. Last season he was 54.0 on and 49.0 off across 992.3 minutes, 5.0 points above his clubs. Chances for per 60 with him on have fallen from 2.65 to 2.19, chances against have risen from 2.26 to 2.66, and his five-on-five points per 60 have fallen from 2.12 to 1.49, 68 games against nine. Goals with him on the ice are five for and eight against through nine games.
The card#
His 2025-26 card, built on the 68 games in Seattle and Columbus, rates him at +10.5 Pine Net Rating per 82 games, the 76th percentile of 469 league forwards and the first-line tier. Offense was +14.0 per 82 at the 84th percentile and defense minus 3.5 at the 32nd. The power-play part of that rating was already the negative one, minus 1.71, on 6.70 chances for per 60 at five-on-four, the 41st percentile of 313 forwards.
This season's rating is a season total in different units, and the two cannot be compared as numbers. At minus 1.37 through nine games he ranks 13th of 20 rated Sharks skaters. The card withholds a percentile under 200 five-on-five minutes, and he has played 120.7.
The arguments against me#
- The comparison is to a 68-game line that Columbus weights, and this is the real one. His first nine games last season, all in Seattle, looked like these nine: 36.1 percent of Seattle's five-on-four minutes across his 29 games there, a 46.7 percent offensive-zone start share in the opening nine, and 49.3 percent of the five-on-five chances over 123.4 minutes. The Columbus job arrived at game 30.
- The line he is on now wins its minutes. With Wennberg and Tyler Toffoli since the Oct. 12 practice he has 60.0 percent of the chances over 29.1 minutes, with one goal for and none against. The 46.2 percent over 36.5 minutes with Celebrini and Smith, one for and three against, is what pulls his season share down toward the team's.
- The goals have come anyway. Three on 19 shots is 15.8 percent, against a career 13.2 percent on 744 shots, and his average shot speed has never been higher.
The five-on-four minutes are the number that has moved furthest. Marchment has 15.9 of San Jose's 50.3 through nine games, against 101.5 of Columbus's 150.2 across 39.
Sources: NHL Edge (2025-26 and 2026-27); the NHL's player pages, game logs and stats feed; MoneyPuck's season, line-combination and game-by-game files (2025-26 and 2026-27); the site's 2025-26 hockey card.