Los Angeles scored seven on the chances San Jose allows most nights
Los Angeles turned 3.94 expected goals into seven goals, against the 3.90 per game San Jose allowed through its first 16 games.
Los Angeles beat San Jose 7-2 on Wednesday at Crypto.com Arena, the most goals San Jose has allowed in a game this season. The chances behind them were ordinary: 3.94 expected goals on 44 unblocked attempts, against the 3.90 per game San Jose allowed through its first 16. Adrian Kempe scored three; Los Angeles led 3-0 after the first period and 6-1 at 2:12 of the third.
An ordinary night#
MoneyPuck's all-situations figures, excluding empty-net attempts, put Wednesday eighth-highest in expected goals against across San Jose's 17 games. At five-on-five, Los Angeles's 2.21 ranked ninth-highest across those 17, below San Jose's previous 2.42 average through 16 games. San Jose's 39.6 percent five-on-five share ranked eighth-lowest across 17 games, against 42.7 percent through 16 games. The Sharks trailed for 58:37; adjusting for score and venue lowered their five-on-five share to 38.8 percent across Wednesday's 42.5 minutes.
Goals versus chances#
Seven goals against 3.94 expected leaves a gap of plus 3.06. The 27 shots that reached the net carried 2.79, against a 2.53 average through 16 games, which leaves plus 4.21. Both were the largest goals-minus-expected-goals gaps across San Jose's 17 games, excluding empty-net goals. Boston on Oct. 13 ranked second by each measure, plus 1.68 and plus 3.01. MoneyPuck prices attempts before they are saved or missed, so the on-goal figure is no goalie baseline.
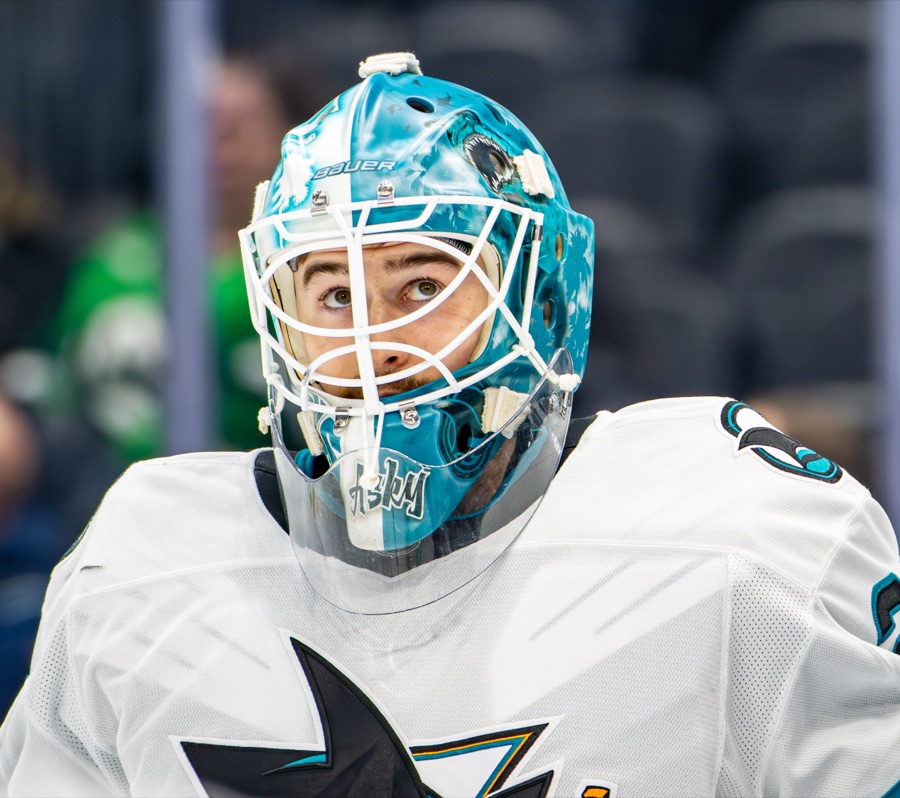
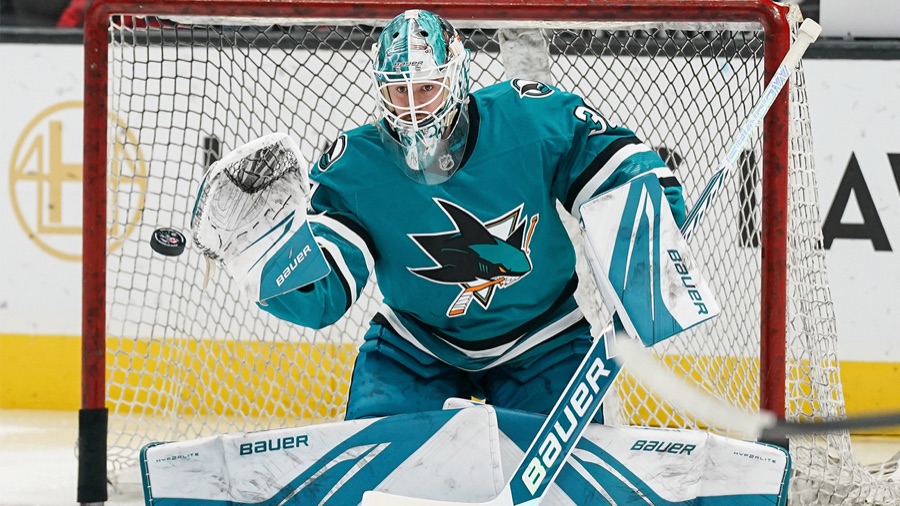
San Jose's Yaroslav Askarov saved 20 of 27 over all 60:00. Sheng Peng wrote in San Jose Hockey Now's game notes that he was surprised Askarov remained in during the third period. Askarov's season save percentage fell from .901 on 293 shots to .8875 on 320; Los Angeles's Darcy Kuemper saved 30 of 32.
San Jose's two#
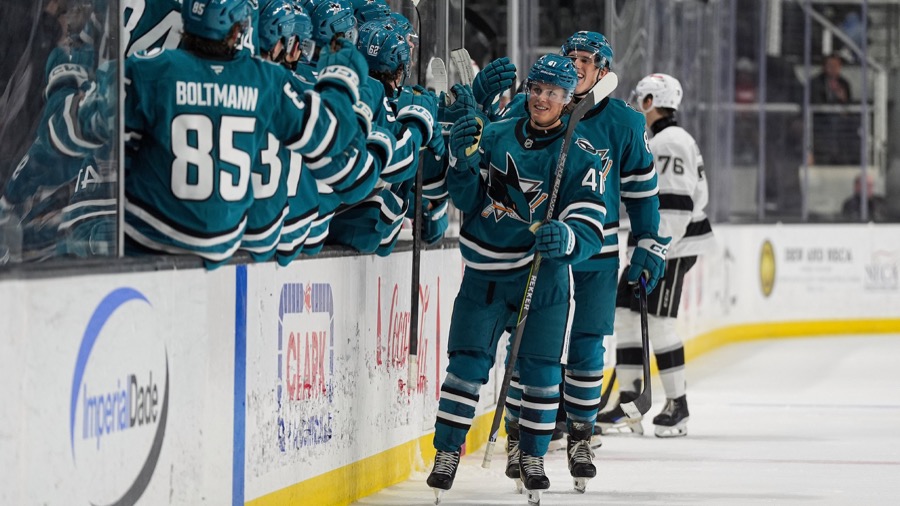
Macklin Celebrini's power-play goal from 40 feet was his first goal in seven games. Ivar Stenberg's power-play goal from 41 feet went off Joel Edmundson's foot, Peng reported; together the goals carried 0.07 expected goals. Los Angeles's penalty kill stopped four of San Jose's six power plays and is still last of 32 teams through Wednesday, at 62.2 percent. San Jose's five-on-five offense produced 1.45 expected goals on 31 unblocked attempts and zero goals on 20 shots.
The kill#
Los Angeles went 3 for 5 on the power play, generating 1.58 expected goals in 6:26 at five-on-four. That single-game rate of 14.7 per 60 minutes compared with San Jose's 9.4 allowed per 60 across 78.6 penalty-killing minutes through 16 games. San Jose had allowed eight power-play goals through 16 games, never more than two per game; Wednesday made it 11 through 17. NHL shift charts put Darnell Nurse and Collin Graf on for all three Kings power-play goals.
San Jose's season kill fell from 84.9 percent, 45 of 53, to 81.0 percent, 47 of 58, ranking 12th among 32 teams through Wednesday. The goals split 4-0 for Los Angeles at five-on-five and 3-2 for Los Angeles on the power plays.
The pairs#
Before Wednesday, MoneyPuck's five-on-five pair rows had Nurse and Michael Kesselring allowing more expected goals per 60 minutes, 3.59 across 195 minutes, than Sam Dickinson and Jacob Trouba, 2.59 across 184. Wednesday reversed that order. Dickinson and Trouba went 0.30 to 1.05 in expected goals over 12.4 five-on-five minutes, with unblocked attempts 5-13 and two goals against. Nurse and Kesselring went 0.58 to 0.44 over 12.0 five-on-five minutes, attempts 12-5.
Eric Pohlkamp's NHL debut brought 17:37 and three shots beside Dmitry Orlov; their five-on-five expected goals were 0.26 to 0.21 in 11.7 minutes. That is a single game's partnership. Peng reported second-period lines of Misa-Celebrini-Smith, Marchment-Graf-Sherwood and Stenberg-Bystedt-Toffoli; MoneyPuck's line rows put Misa-Celebrini-Smith at 0.25 to 0.14 expected goals over 8.0 five-on-five minutes.
The room#
San Jose is 7-9-1, and its three straight regulation losses have produced four goals for and 14 against. Peng reported a players-only meeting behind closed doors afterward. Peng quoted Kiefer Sherwood saying, "It's not on the coaches right now." Peng also reported Celebrini said the discussion would stay in the room and disputed that the team was emotionally fragile. Coach Ryan Warsofsky said he would examine what he could do differently, Peng reported.
The schedule sends San Jose to Minnesota on Friday and Dallas on Saturday. Through 17 games, the Sharks' five-on-five goals stand at 20 for and 38 against.
Against me#
The arguments against this, and the first one is real.
- The model does not record coverage. Peng described Kempe's first goal as a five-on-five breakaway behind Dickinson's pinch, his second as a five-on-five chance after Kesselring's exit-pass turnover with open ice inside the box, and Byfield alone in front for his second, a power-play goal. An ordinary count can conceal chances better than their prices; MoneyPuck assigned those attempts 0.208, 0.173 and 0.111.
- An ordinary San Jose night is a bad one by league measure. MoneyPuck's league summary puts San Jose highest in expected goals against per game among 32 teams, 3.95 through 16 games including empty-net attempts. Its 42.7 percent five-on-five expected-goal share through 16 ranks fourth-lowest among 32 teams.
- Seven goals on 44 unblocked attempts is one night's conversion, and one game is one game. Boston's plus 1.68 is the nearest goals-minus-expected-goals gap across San Jose's 17 games; Kempe's three goals carried 0.52 expected goals combined.
Three stars#
- Adrian Kempe (LAK). Three goals and an assist; two of the goals came at five-on-five, where Los Angeles won 4-0, and all three were priced at 0.52 expected goals combined.
- Erik Haula (LAK). A five-on-five goal and the only assist on Armia's, on a line that went 0.34 to 0.09 in expected goals in 8.6 five-on-five minutes.
- Corey Perry (LAK). No points, and the widest five-on-five margin of any skater in the game, 0.89 to 0.26 in 11.1 minutes, with the most individual expected goals at that strength, 0.50.
The NHL's order was Kempe, Artemi Panarin, Quinton Byfield. Haula and Perry replace Panarin and Byfield here. Byfield's two goals both came on power plays, and Panarin had four assists on a line outattempted at five-on-five, 12 to 9 in 11.0 minutes.
Sources: NHL game data, box score and shift charts; MoneyPuck game and player data; NHL standings and team statistics; San Jose Hockey Now (Sheng Peng).