Is Bryce Underwood a better passer, or did he play Western Michigan and UTEP?
Half of Bryce Underwood's 68 dropbacks this season have been successful plays, up from 41 percent as a freshman. Forty-nine of the 68 came against Western Michigan and UTEP. Iowa, on Saturday, is the second Power 4 defence he has faced this year.
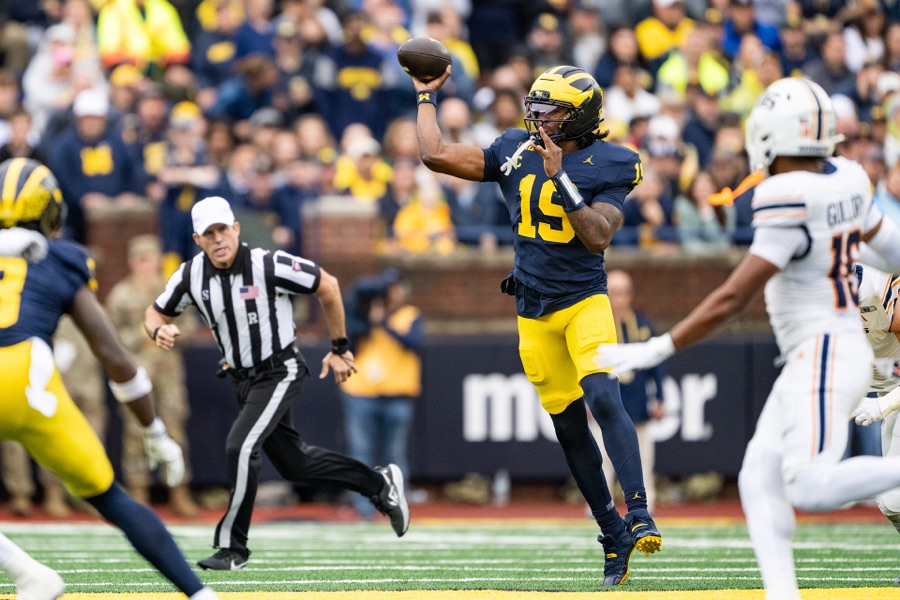
Against Western Michigan and UTEP this month, Bryce Underwood completed 31 of 47 passes. That is 66.0 percent.
Against New Mexico and Central Michigan last September, he completed 37 of 56. That is 66.1 percent.
Those are the four Group of Five opponents of his college career, and a year in which Michigan changed its head coach moved his completion rate against them by one-tenth of a point. Neither sample is large enough to read even that much into (n = 47 and n = 56). His season line tells a different story.
The season line, and what is inside it#
By the play-by-play, Underwood looks improved. A dropback is every pass attempt plus every sack. A successful play gains half the needed yardage on first down, 70 percent of it on second, and all of it on third or fourth. By that standard, 50.0 percent of his 68 dropbacks this season have succeeded. As a freshman it was 41.4 percent of 355.
Expected points added per dropback, which prices every play by how much it changed a team's scoring outlook given down, distance and field position, tells the same story. It was +0.14 in 2025. It is +0.31 now. That is model output from CollegeFootballData, not a count, and it is labelled that way below.
Kyle Whittingham said on September 7, before Oklahoma, "He's our QB right now. It's not something that's infinite. At some point, we've got to turn a corner and we've got to see improvement." Read cold, the season line says the corner has been turned.
Then look at who was across the line. Forty-nine of Underwood's 68 dropbacks this season, 72 percent, came against Western Michigan and UTEP. In 2025, 58 of his 355 came against Group of Five teams, which is 16 percent. The 2026 season line is mostly a line against the kind of defence he was already good against, and the 2025 line is mostly a line against the Big Ten.
Two seasons, sorted by opponent#
| Opponents | Dropbacks | Comp-Att | Yds/att | Success rate | EPA per dropback (model) |
|---|---|---|---|---|---|
| 2025, New Mexico and Central Michigan | 58 | 37-56 | 8.7 | 51.7% | +0.48 |
| 2026, Western Michigan and UTEP | 49 | 31-47 | 8.4 | 57.1% | +0.43 |
| 2025, at Oklahoma | 25 | 9-24 | 5.9 | 20.0% | -0.05 |
| 2026, Oklahoma at Michigan Stadium | 19 | 9-17 | 6.5 | 31.6% | -0.02 |
| 2025, nine Big Ten games | 227 | 133-213 | 7.5 | 44.1% | +0.14 |
| 2025, Citrus Bowl, Texas | 45 | 23-42 | 4.7 | 26.7% | -0.21 |
| 2025, all 13 games | 355 | 202-335 | 7.2 | 41.4% | +0.14 |
| 2026, all three games | 68 | 40-64 | 7.9 | 50.0% | +0.31 |
Completions, attempts and yards are Michigan's official box scores. Dropbacks, success rate and expected points are computed from the play-by-play, which reconciles to the box score's attempts plus sacks in every row.
Read the table in pairs. The first two rows are the same class of opponent a year apart, and the expected points went down slightly while the success rate went up by 5.4 points on 49 plays. The next two rows are the same opponent a year apart, Oklahoma, and both measures moved up without leaving the bottom of his range: a 31.6 percent success rate would have ranked fifth-lowest of his 13 games in 2025. The 2025 game in Norman is still the lowest completion rate of his 16 college games, 9 of 24. The last two rows are the season lines, and they differ by +0.17 in expected points per dropback, where the matched pairs differ by -0.05 and +0.03.
In expected points, that is what a schedule effect looks like.
I ran it two ways#
The direct test takes what Underwood did against each kind of opponent in 2025 and asks what his season line would have been with this year's mix of 49 Group of Five dropbacks and 19 against a Power 4 defence.
With his 2025 Big Ten games as the Power 4 benchmark, the reweighted 2025 line is a 49.6 percent success rate and +0.38 expected points per dropback. With his 2025 game at Oklahoma as the benchmark, since Oklahoma is the Power 4 team he has actually played this year, it is 42.8 percent and +0.33.
His real 2026 line is 50.0 percent and +0.31.
So the matched gain in success rate is somewhere between 0.4 points and 7.2, depending on which benchmark you trust, and the matched gain in expected points is below zero under both. The ordinary sampling error on a 68-play success rate is about six points. The data cannot answer this yet. What it can say is that all of the rise in expected points, and anywhere from 1.4 to 8.2 points of the raw 8.6-point rise in success rate, is consistent with the schedule alone.
What rose, if anything did#
The two measures disagree for a reason. Success rate rewards a steady gain and does not care how big it is. Expected points rewards size. A passer who completes more short throws and fewer long ones can lift the first without moving the second, and the play-by-play points that way.
Against Group of Five opponents, 8 of his 56 attempts in 2025 went for 20 yards or more, and 5 of 47 have this season. Of the 62 attempts this season that the play-by-play tags by depth, 11 are marked deep and one was caught, a 28-yarder to JJ Buchanan on third-and-10 in the final minute against Western Michigan. The 47-yard touchdown to Buchanan that won that game on the last play carries no depth tag.
The targets are narrow. Buchanan and Andrew Marsh have caught 30 of Underwood's 40 completions, 15 each, for 399 of his 504 yards, and the play-by-play names one of them as the target on 47 of his 64 attempts.
The offensive line has started three different combinations of five in three games; Andrew Sprague started the first two and not the third. Underwood's sack rate through it is 4 of 68 dropbacks, 5.9 percent, against 20 of 355, 5.6 percent, last season. Whatever the shuffling has cost, it has not shown up there.
Michigan is not asking him to throw less#
Underwood is attempting 21.3 passes a game, down from 25.8 across 2025. That looks like a staff limiting its quarterback. The run-pass mix says otherwise.
On first and second down, in the first three quarters, with the score within eight points, Michigan has dropped back to pass on 44.2 percent of its plays this season (n = 95). In 2025 the figure was 44.4 percent (n = 354). Sacks count as passes and scrambles as runs, because the feed does not mark a scramble.
The difference in attempts is the difference in snaps. Michigan has run about 56 runs and dropbacks a game this season, against 63 in 2025.
Two splits too small to read#
On third down Underwood has converted 6 of 15 dropbacks this season, at an average of 7.5 yards to go, against 30 of 95 at 8.4 in 2025. One drive can swing fifteen third downs.
His 2025 second halves were worse than his first halves, a 36.5 percent success rate on 156 dropbacks against 45.2 on 199. This season the shape is the same, 54.3 percent before halftime on 46 and 40.9 after on 22. Twenty-two plays cannot say whether that pattern is a trait or an accident.
The standing call on completion rate#
Grant Lombard has an open call that Underwood's completion percentage across the 2026 regular season finishes higher than 60.3 percent, his 2025 figure of 202 of 335 across 13 games. After three games it is 62.5 percent, 40 of 64. It resolves after the regular season ends on November 28.
Saturday#
Iowa is the test the matched table is missing. Its pass defence ranked 13th of 136 FBS teams last season in expected points allowed per pass play, on CollegeFootballData's figures, and Oklahoma's ranked 17th. Iowa is 3-0 and has allowed 13 points.
The box-score number to watch is yards per attempt. His 2025 Big Ten figure was 7.5, on 1,601 yards and 213 attempts, and against Oklahoma this month it was 6.5. Above 7.5 against Iowa, with a success rate above his 2025 Big Ten 44.1 percent, would be the first like-for-like evidence that the passer has moved, and it would move my read, though one game of perhaps 20 dropbacks carries about 11 points of sampling error. Something near the Oklahoma line would make every matched comparison so far show last season's passer.
The call#
One goes on the ledger, and it asks a different question from the standing call on completion rate.
Underwood's yards per attempt across Michigan's nine 2026 Big Ten regular-season games is 7.52 or lower, which is his figure across the nine Big Ten games of 2025 (1,601 yards on 213 attempts).
Matched to comparable opponents, nothing in three games shows a passer who gains more per throw than he did in 2025, the deep game has produced one tagged completion in 11 tries, and the conference schedule includes Iowa, Penn State, Indiana, Oregon and Ohio State.
The case against it is real. Underwood is in his second season, and the usual expectation is that a quarterback's second year is better than his first. A Big Ten figure of 7.52 on 213 attempts can be beaten by one long touchdown a game, and Buchanan is averaging 17.7 yards a catch. His 2025 conference line also included 3.5 yards an attempt against Ohio State and 5.1 against Michigan State, which is a low bar to clear in any game that is not those two.
Revisit on November 29, the morning after Ohio State.
Counting stats from Michigan's official box scores for all 16 of Underwood's college games, including the December 31, 2025 Citrus Bowl. Rate stats from CollegeFootballData play-by-play for the same games. A dropback is a pass attempt or a sack; spikes, kneels and penalty-nullified plays are out, and scrambles cannot be separated from designed runs. Success rate uses the 50/70/100 percent thresholds by down. The feed codes a handful of 2025 plays differently from the box score and carried one duplicated interception, which was removed; dropback counts reconcile in every table row. Known weakness: opponent class is Group of Five or Power 4 and nothing finer, and Central Michigan's 2025 pass defence allowed fewer expected points per pass than seven of Michigan's nine Big Ten opponents.
Sources: Michigan Athletics official box scores and season statistics, 2025 and 2026; CollegeFootballData play-by-play, box score and season advanced-statistics feeds; Kyle Whittingham's September 7, 2026 press conference as transcribed by MGoBlog, Maize n Brew and The Michigan Daily.