Every Sharks Point Total Is Reasonable Until You Add Them Up
Professor Hockey published a 2026-27 point projection for all 21 skaters he expects on San Jose's opening roster, which is rarer than it sounds, because a complete board is the only kind anybody can add up. His comes to 796 points. San Jose's skaters scored 674 last season, and the gap between those two numbers is not a bet on the players.
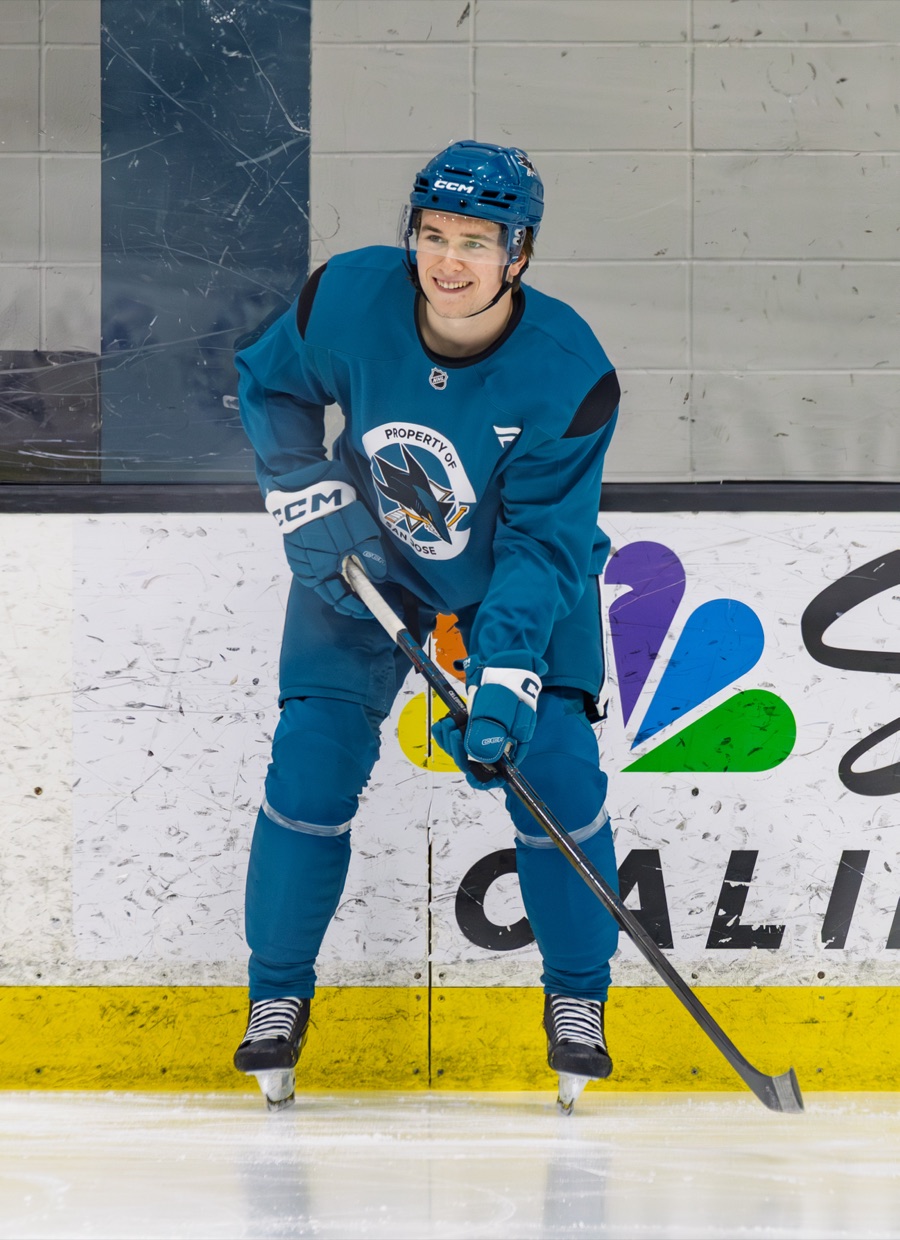
Point projections are almost always read one at a time, and that is the only way most of them survive. Somebody says Will Smith gets to 80 and you nod, because he was on a 70-point pace before he got hurt. Somebody says Sam Dickinson gets to 25 and you nod, because 14 from a rookie defenseman who was handed almost no power play is not a ceiling. Each one arrives alone, gets weighed against one man's last season, and passes.
Then there is the rare case where somebody publishes the whole thing. Professor Hockey did that this week, working through the 21 skaters he expects on San Jose's opening roster and putting a number on each. Goaltenders excluded, which is fair, since asking a goalie for points is asking the wrong question.
A complete board has a property that a single projection does not. You can add it up.
The board#
Fourteen of these come from his August 12 video. The other seven are players he had already given numbers to earlier in the same series and declined to repeat himself on.
| Player | 2026-27 call | 2025-26 with San Jose |
|---|---|---|
| Macklin Celebrini | 120 | 115 in 82 games |
| Will Smith | 80 | 59 in 69 |
| Mason Marchment | 60 | did not play for San Jose |
| Michael Misa | 60-plus | 21 in 45 |
| Ivar Stenberg | roughly 50 | did not play for San Jose |
| Igor Chernyshov | 50 | 19 in 28 |
| Alexander Wennberg | 40 | 55 in 80 |
| Kiefer Sherwood | 40 | 13 in 28 |
| Michael Kesselring | 40 | did not play for San Jose |
| Collin Graf | 35 | 46 in 81 |
| Darnell Nurse | 35 | did not play for San Jose |
| Luca Cagnoni | 35-plus | 0 in 3 |
| Tyler Toffoli | 30 | 49 in 79 |
| Sam Dickinson | 25 | 14 in 72 |
| Jacob Trouba | 25 | did not play for San Jose |
| Adam Gaudette | 20 | 25 in 66 |
| Dmitry Orlov | 20 | 37 in 82 |
| Zack Ostapchuk | 15 | 7 in 59 |
| Barclay Goodrow | 7 | 12 in 82 |
| Nolan Allan | 5 | did not play for San Jose |
| Ty Dellandrea | 4 | 11 in 46 |
796 points. Two of the twenty-one are floors rather than estimates and a third is an approximation, so if anything the real figure he would defend is 796 or a shade above.
San Jose's skaters produced 674 points in 2025-26, goaltenders excluded from both sides of that comparison.
What 796 points looks like on a scoreboard#
Points are not goals, so the board has to be converted before it means anything, and the cleanest conversion available is San Jose's own. The Sharks scored 249 goals last season and their skaters banked 674 points on those goals, which is 2.707 points per goal. That implies about 1.71 assists per goal, which is an ordinary NHL figure and not an artifact of a bad team. (A generic rule of thumb gives a different answer, which is the reason to use this club's own ratio and show the working.)
Two bounds, and the truth is between them. If those 21 men are the entire offense and nobody else scores a point all year, 796 points is 294 goals. If they account for 95.7 percent of the team's points, which is exactly what last season's 21 highest-scoring Sharks did, the full roster reaches about 832 points and 307 goals.
So: roughly 294 to 307. His own summary of the board, in the last minute of the video, is that it describes "a team scoring like 300 plus goals," which lands at the top of his own range and is a fair reading of it.
Now put that on the calendar. The 2026-27 season runs 84 games, 42 home and 42 road, from September 29 to April 10. Across 84 games, 294 to 307 goals is 3.50 to 3.65 goals per game.
San Jose scored 3.04 per game last season and finished 17th of 32 in goals. Here is the top of the league it would be joining, per Hockey Reference's 2025-26 season page:
| Team | Goals for | Per game |
|---|---|---|
| Colorado | 298 | 3.63 |
| Carolina | 291 | 3.55 |
| Pittsburgh | 290 | 3.54 |
| Tampa Bay | 286 | 3.49 |
| Buffalo | 283 | 3.45 |
| Edmonton | 282 | 3.44 |
| San Jose | 249 | 3.04 |
Colorado led the NHL last season at 3.63 a game. Stretch that rate over an 84-game schedule and it is 305 goals, which sits inside "300 plus." The board is not describing a good young offense taking a step. It is describing the best or second-best offense in hockey.
Now read it player by player, because it does not look like that at all#
Here is where the thing gets genuinely strange, and where it stops being a story about optimism.
Of the fifteen players on that board who actually played for San Jose last season, seven are projected to score fewer points than they did. Wennberg drops 15. Toffoli drops 19. Orlov drops 17. Graf drops 11. Dellandrea drops 7, and Gaudette and Goodrow drop 5 apiece. Seventy-nine points of decline, and the reasoning behind it is sound: Wennberg loses the second-line center job to Misa and loses the first power-play unit, Graf and Toffoli slide down a deeper lineup, and there are ten top-nine forwards competing for eight power-play slots across two units.
Celebrini, the biggest number on the whole board, is barely a raise at all. He scored 115 in 82 games, which is 1.40 a night. The call is 120 in 84, which is 1.43. That is a two percent bump on a 20-year-old coming off a franchise record, from a projector who explicitly refused to draw a straight line through it. "By the age of 24, am I thinking he's going to be putting up like 170 points?" he asks. "Probably not."
So the board is not built on anybody having a monster year. Where does 796 come from?
The assumption doing all of the work#
The fifteen returning players scored 483 points in 902 games last season. That is 0.535 points per game, and it is 902 games out of a possible 1,230, so the group was available for 73 percent of the schedule.
The board asks those same fifteen for 581 points.
Take the honest route to that number first. Give them last season's exact rate and last season's exact availability, then stretch it over the longer schedule: 73 percent of 1,260 available man-games is 924 games, and 924 games at 0.535 is 495 points. The board wants 86 more than that.
Now go the other way and ask health to do all of it. At last season's rate, 581 points requires 1,085 man-games, which is 86 percent of the schedule from a group that managed 73 percent.
That is the whole projection, sitting in one number. Set against the 84 games he says he built almost every figure on, the fifteen returning Sharks are projected to score at 0.461 points per game, down from 0.535. Every man on that list is being asked to get slightly worse per night and to be there far more often. (He does not assume 84 for every man and says so as he goes, which makes 1,260 a ceiling and 0.461 a floor. Chernyshov he pencils at "77 or 78," Dellandrea at 40 to 45, and Goodrow he will not commit past 60, on the grounds that playing him a full 84 "would be coaching malpractice." Hand those three exactly the games he suggests and the group still comes out at about 0.49, under last season either way.) The best offense in hockey, arrived at by nobody improving.
Look at the table again with that in mind. Chernyshov's 19 in 28 games is 0.68 a night, and his call of 50 over a full year is 0.60. Kiefer Sherwood's 13 in 28 with San Jose is the Sharks-only half of a season that was 36 points in 72 games across Vancouver and San Jose, a 0.50 rate that projects to 42 over 84, so his 40 is if anything a small trim. Misa's 21 in 45 is the one real leap on the list, and Cagnoni is being projected off three career games. (Three games is not a sample. It is a rumor with a jersey number, and it is 35-plus points on the board either way.)
The six who were not here#
The other 215 points belong to Marchment, Stenberg, Kesselring, Nurse, Trouba and Allan, none of whom played a game for San Jose last season. That looks like a windfall until you count what walked the other way. The skaters no longer on this roster took 191 points with them, led by William Eklund's 53, John Klingberg's 27 and Mario Ferraro's 23.
So the turnover is close to a wash, 215 in against 191 out, a net of 24 points. Which leaves the returning fifteen's 98-point raise as almost the entire distance between 674 and 796, and that raise is a health assumption wearing a scoring costume.
He said it himself, and it is the most useful sentence on the board#
None of the above is a gotcha, because he closes the video by handing you the discount:
Obviously, for all of these or for most of these predictions, I was going with a full 84 game season. It is extremely unlikely that more than a couple of players actually play a full 84 game season. So, don't expect these point totals to be fully accurate, but trying to stay in the ballpark there if I can assume perfect health for everybody.
That is the correct caveat, stated plainly, and it is doing more work than any individual number he gave. Apply a modest ten percent haircut for the games nobody plays and the board lands between 265 and 276 goals. That is a top-ten offense and a genuinely large improvement, up 16 to 27 goals on last season while playing two extra games.
It is also a completely different claim from a top-two offense, and the only thing separating the two is whether you read the last sixty seconds.
The number to carry#
If you want one figure for how good the 2026-27 Sharks offense can be, use 265 to 276 goals, not 300. The 300 is real arithmetic performed on a real board, and it assumes a version of this roster that has not existed since Celebrini arrived: everybody upright, all year, on a schedule that just got longer.
Seven of the fifteen men who were here are projected to score less. That is what the projection actually says about the players. The rest of it is a projection about the trainer's room.
Sources: Professor Hockey's August 12, 2026 video "Predicting Every San Jose Shark Player's Point Total for the 26-27 Season," and his July 27 and August 4 videos for the seven players he declined to repeat; Hockey-Reference's 2025-26 NHL season summary and San Jose Sharks and Kiefer Sherwood pages for every baseline, goals-for total and league rank; and the NHL's own release on the 2026-27 regular-season schedule for the 84-game format and season dates. Nobody from this site attended anything described here.