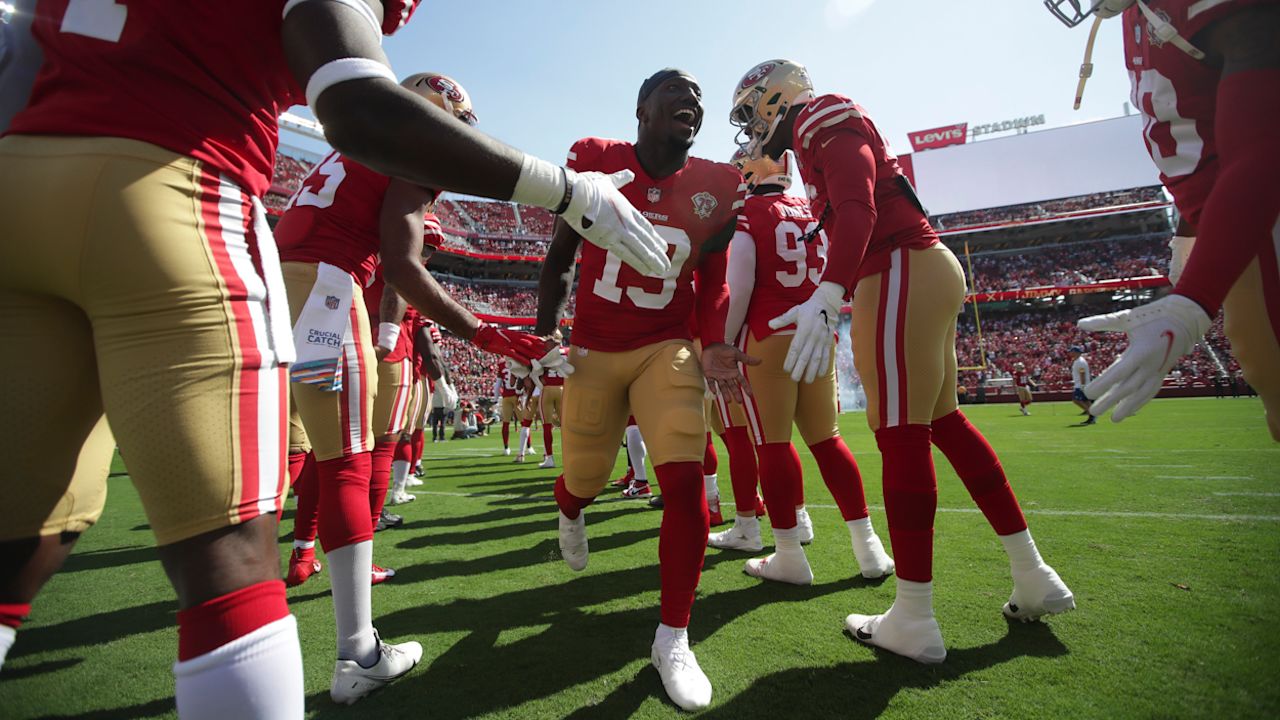
Leading the NFL in efficiency at 5-0 has been worth less than half a win
The 49ers are 5-0, plus 61, and first in net expected points per play. Fifty-one teams started 5-0 from 1999 through 2025, and how well they played in those five games told almost nothing about what came next.
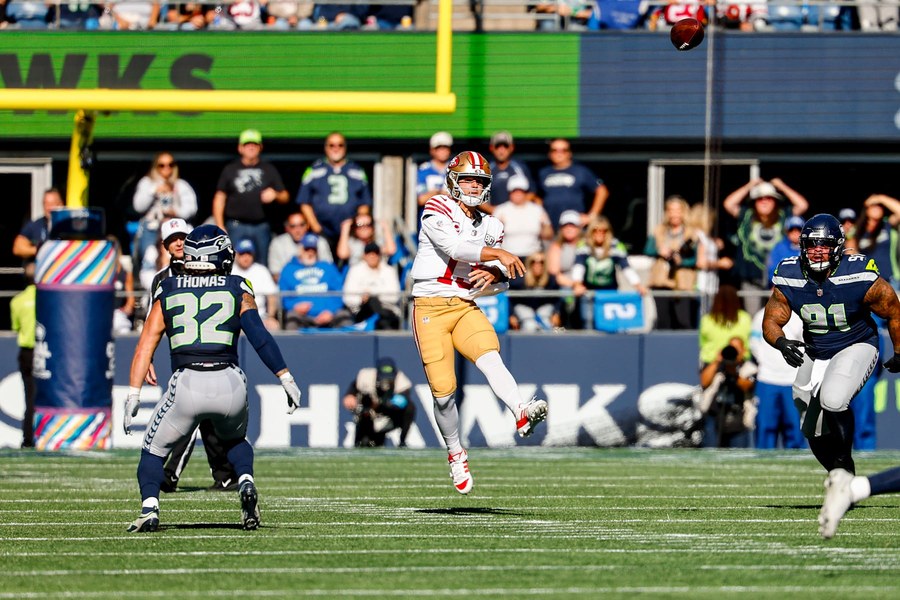
A 5-0 team that is also the best team in the league by the efficiency numbers ought to be a safer bet than a 5-0 team that got there on close games. That is the intuition. Since 1999, the difference has been worth about four-tenths of a win over the rest of a season.
The 49ers are the test case this year. They are 5-0 and have outscored opponents by 61 points. They also rank first in net expected points added per play, which is the offense's EPA per play minus the EPA per play the defense allows. Expected points added, or EPA, is a model's estimate of how much each snap moved a team's expected score; the version here is the public nflfastR model. San Francisco's offense ranks 2nd at plus 0.21 a play. Its defense ranks 4th at minus 0.07. The net, plus 0.28, is first.
Minnesota is the league's other 5-0 team. It ranks 6th, at plus 0.11.
What 5-0 has meant#
From 1999 through 2025, 51 teams won their first five games. Across the rest of their regular seasons they went 358-209. That is 63 percent, and it is the single most useful number here.
Forty-six of the 51 made the playoffs. Eighteen reached the Super Bowl. Five won it. Two of the 13 who lost were the 49ers, in 2019 and 2023, and both of those teams started 5-0.
So the start matters a great deal. The question is whether the shape of the start matters on top of it.
The ten who led the league#
Ten of the 51 were also first in net EPA per play after five games, as the 49ers are now. Here is what they did with the rest.
The ten 5-0 teams that also led the NFL in net EPA won anywhere from 27 to 100 percent of the rest
Share of remaining regular-season games won after a 5-0 start, for each team that also ranked first in net expected points added per play after five games, 1999 to 2025. Each label gives the record over the rest of that season. The bottom row is all 51 teams that started 5-0.
Read the bottom row first, then look at how far the ten spread around it. As a group they won 66 percent of the rest, against 63 percent for the 41 who were 5-0 without leading the league. Over 12 games, three points of winning percentage is about four-tenths of a win.
The spread is the finding. The 2007 Patriots did not lose again in the regular season. The 2009 Giants won three of their last eleven and missed the playoffs. The 2003 Vikings missed them too. The highlighted row is the 2023 49ers, who were first in net EPA after five games at plus 0.39 a play, well above this team's plus 0.28, and went 7-5 the rest of the way.
Why the shape of the start goes quiet#
Across all 861 team-seasons in the sample, the first five games tell you a fair amount. Point margin and net EPA per play over those five games each track the rest of the season about equally well, and both do better than the win count.
Among 5-0 teams, almost all of that disappears. Split the 51 into quarters and the gaps are small:
| The 51 teams that started 5-0, split by | Teams | Won of the rest |
|---|---|---|
| Top quarter by net EPA per play after five | 13 | 66.7% |
| Bottom quarter by net EPA per play after five | 13 | 62.1% |
| Top quarter by point margin after five | 15 | 68.7% |
| Bottom quarter by point margin after five | 13 | 63.7% |
Top quarter against bottom quarter is worth a little over half a win across 12 games, by either measure.
There are two reasons, and they stack. Every team in this group is already good, so the measures are sorting good teams from slightly better ones, which is a narrow band. And 12 games is a small sample. At a true 63 percent, chance alone moves a 12-game record by about 1.7 wins in either direction, one standard deviation. A half-win signal sitting inside that noise is real in the direction and nearly invisible in any single season.
The objection that worries me most is schedule. None of these numbers adjust for opponents, and a 5-0 start against weak teams should mean less. It is not the 49ers' problem. Their five opponents are a combined 9-11 in their other games through Week 5, which is ordinary, and Denver and Seattle are 3-1 each.
The projection#
The base rate gives the 49ers 63 percent of their remaining 12 games, about 7.6 wins, for a final record near 12.6 wins. Credit them with the league-leading group's 66 percent and it is 7.9, for about 12.9. Call it 13, with two wins of honest room on either side.
That is lower than the start feels. It is not lower than the history.
The case against the base rate is recent and specific. Three of the six teams that started 5-0 since the schedule went to 17 games won at least 14: the 2022 Eagles, the 2024 Vikings and the 2024 Chiefs. Fourteen needs nine of the last 12, and the extra game is what puts it in reach.
Sample: every team that won its first five regular-season games from 1999 through 2025, n = 51, from the nflverse games file. "First five" is a team's first five games played, not the first five weeks. Ties count as half a win. Efficiency: net expected points added per play on pass and run plays (sacks and scrambles count as passes) over those five games, offense minus defense, from nflverse play-by-play built on the nflfastR model. EPA is model output, not a counted stat. Excluded: three games have no play-by-play in the source (the 1999 Rams' opener and two 2000 games). Where one fell inside a team's first five, that team's efficiency rests on four games; the 1999 Rams in the chart are one. Weakness: no adjustment for opponents or for injuries, and n = 51 cannot separate a half-win effect from noise.
Sources: nflverse games file (scores and schedules, 1999 to 2026) and nflverse play-by-play (1999 to 2026, through Week 5); ESPN standings and the 49ers' 2026 schedule, for the 5-0 record and the plus-61 margin.